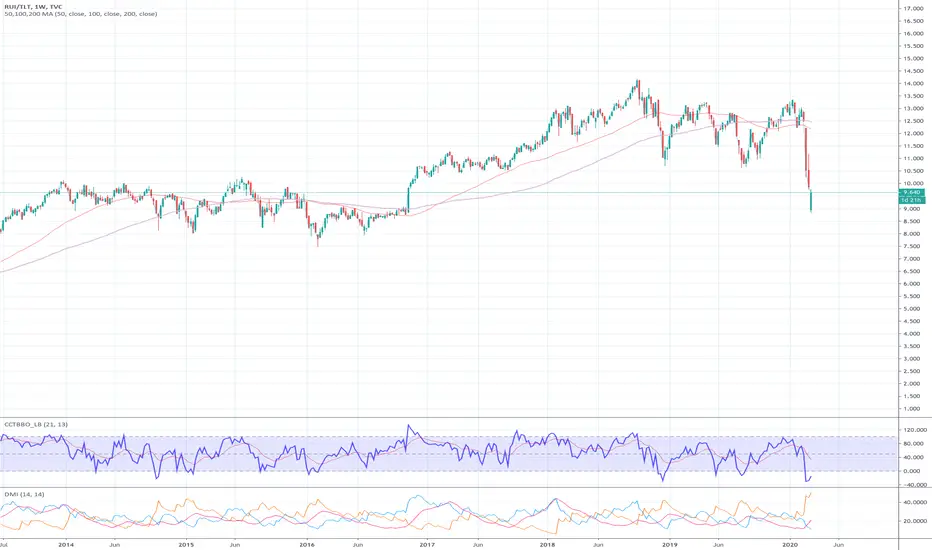
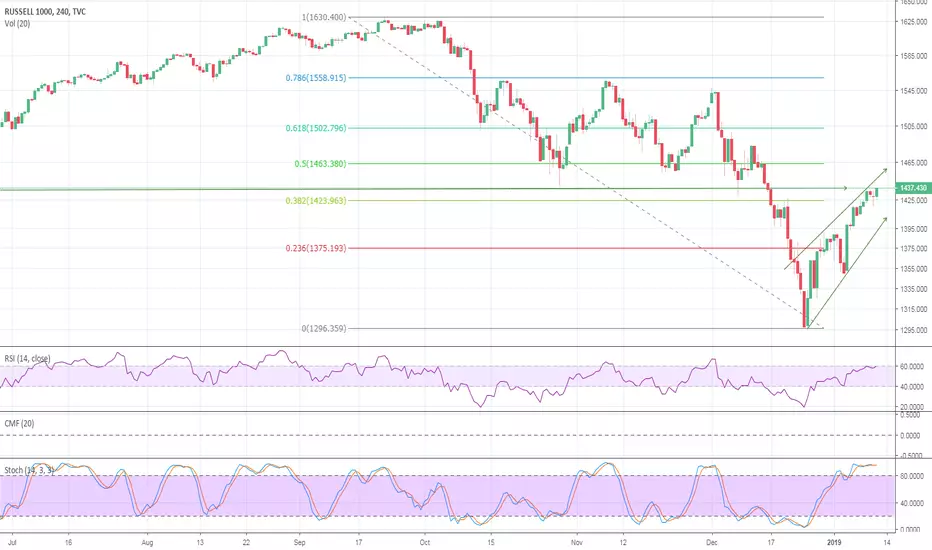
RUSSELL 1000, Triangular-Formation Will Provide Confirmation! Hello Traders Investors And Community, welcome to this update-analysis about the stock-market and its participants, where we are looking at the RUSSELL 1000 which is a major leading index in the US-sector covering the 1000 biggest companies by market-cap, therefore, representing a serious part which
Key data points
No news here
Looks like there's nothing to report right now


See all ideas
Summarizing what the indicators are suggesting.
Oscillators
Neutral
SellBuy
Strong sellStrong buy
Strong sellSellNeutralBuyStrong buy
Oscillators
Neutral
SellBuy
Strong sellStrong buy
Strong sellSellNeutralBuyStrong buy
Summary
Neutral
SellBuy
Strong sellStrong buy
Strong sellSellNeutralBuyStrong buy
Summary
Neutral
SellBuy
Strong sellStrong buy
Strong sellSellNeutralBuyStrong buy
Summary
Neutral
SellBuy
Strong sellStrong buy
Strong sellSellNeutralBuyStrong buy
Moving Averages
Neutral
SellBuy
Strong sellStrong buy
Strong sellSellNeutralBuyStrong buy
Moving Averages
Neutral
SellBuy
Strong sellStrong buy
Strong sellSellNeutralBuyStrong buy
Displays a symbol's price movements over previous years to identify recurring trends.
Frequently Asked Questions
The current value of US Small Cap 1000 Index is 3,225.4963 USD — it has risen by 0.74% in the past 24 hours. Track the index more closely on the US Small Cap 1000 Index chart.
US Small Cap 1000 Index reached its highest quote on Feb 19, 2025 — 3,373.0155 USD. See more data on the US Small Cap 1000 Index chart.
The lowest ever quote of US Small Cap 1000 Index is 117.6500 USD. It was reached on Dec 4, 1987. See more data on the US Small Cap 1000 Index chart.
US Small Cap 1000 Index value has increased by 5.05% in the past week, since last month it has shown a 12.47% increase, and over the year it's increased by 12.47%. Keep track of all changes on the US Small Cap 1000 Index chart.
The top companies of US Small Cap 1000 Index are NASDAQ:MSFT, NASDAQ:AAPL, and NASDAQ:NVDA — they can boast market cap of 3.34 T USD, 3.18 T USD, and 3.17 T USD accordingly.
The highest-priced instruments on US Small Cap 1000 Index are NYSE:NVR, NASDAQ:BKNG, and NYSE:AZO — they'll cost you 7,402.64 USD, 5,262.42 USD, and 3,644.75 USD accordingly.
The champion of US Small Cap 1000 Index is NASDAQ:PLTR — it's gained 521.84% over the year.
The weakest component of US Small Cap 1000 Index is NYSE:WOLF — it's lost −84.05% over the year.
US Small Cap 1000 Index is just a number that lets you track performance of the instruments comprising the index, so you can't invest in it directly. But you can buy US Small Cap 1000 Index futures or funds or invest in its components.
The US Small Cap 1000 Index is comprised of 1003 instruments including NASDAQ:MSFT, NASDAQ:AAPL, NASDAQ:NVDA and others. See the full list of US Small Cap 1000 Index components to find more opportunities.