US10Y UNITED STATES GOVERNMENT 10 YEAR BOND YIELD .US 10-Year Treasury Yield Reaction to July 15, 2025 Economic Data
Key Economic Data (July 15, 2025)
Indicator Actual Forecast Previous
Core CPI m/m 0.2% 0.3% 0.1%
CPI m/m 0.3% 0.3% 0.1%
CPI y/y 2.7% 2.6% 2.4%
Empire State Mfg Index 5.5 — -8.3
Market Reaction: US 10-Year Treasury Yield
Yield Movement:
The US 10-year Treasury yield rose sharply to 4.495% on July 15, 2025, up from 4.43% the previous market day—a gain of 7 basis points.
Immediate Cause:
This jump occurred as the inflation data, while showing softer core CPI than forecast, delivered a higher-than-expected annual CPI (2.7% y/y vs. 2.6% forecast) and robust CPI m/m. Additionally, the Empire State Manufacturing Index rebounded strongly, further supporting concerns over persistent price pressures and economic momentum.
Market Interpretation:
Investors increasingly scaled back expectations for near-term Federal Reserve rate cuts, causing a sell-off in Treasuries and pushing yields higher.
Persistent inflation—especially with annual CPI running above consensus—suggests the Fed may need to keep rates higher for longer, amplifying bond market volatility.
The improved manufacturing sentiment also fueled the belief that the US economy remains resilient, reinforcing the hawkish read on interest rates.
Summary Table: US 10-Year Yield
Date Yield Daily Change
July 15, 2025 4.495% +0.07%
July 14, 2025 4.43% —
Key Takeaways
US10Y jumped by 7 bps to its highest level in five weeks after the mixed inflation report and strong manufacturing data.
Investor sentiment shifted toward fewer and later Fed rate cuts as inflation proved more stubborn than forecast.
The yield reaction underscores ongoing sensitivity to inflation surprises and economic resilience in 2025.
The bond market’s move highlights that even minor upsets to the inflation outlook can quickly ripple through rates, especially when compounded by positive growth signals.
#US10Y
US Government Bonds 10 YR Yield
4.420%R
−0.035−0.79%
Yield
%
No trades
98'20'8% of parR
+0'08'7+0.28%
Price
US10Y trade ideas

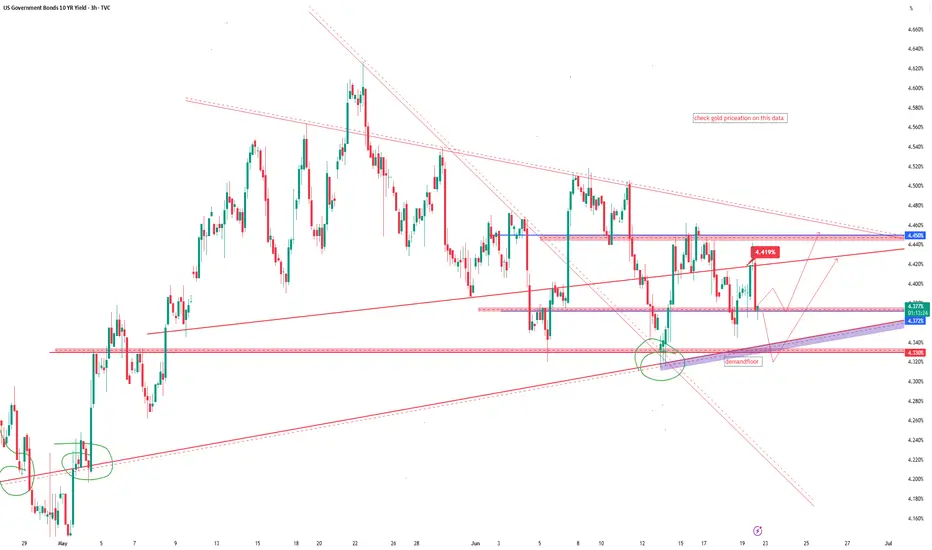
US 10Y TREASURY: tariff tensions rattle bonds During the previous week there has not been important US macro data scheduled for a release, however, news regarding tariffs has been the ones which shaped investors sentiment and also, US bond yields. It was indeed a no-clear-direction trading week when it comes to 10Y Treasury benchmark yields. The week started with a strong move to the upside, from 4,32% up to 4,39, then there was a push back, while yields ended the week at 4,41%. News regarding tariffs were the ones that shaped Friday's sentiment on the market.
Saturday brought news that the US Administration is implementing tariffs of 30% on goods imports from Europe and Mexico. This information is still not reflected in market yields, but will certainly be with the start of the trading week on Monday. Aside from tariffs news, the week ahead brings some important US macro data, like June inflation, PPI and University of Michigan Consumer Sentiment on Friday, implying that another volatile week is ahead.
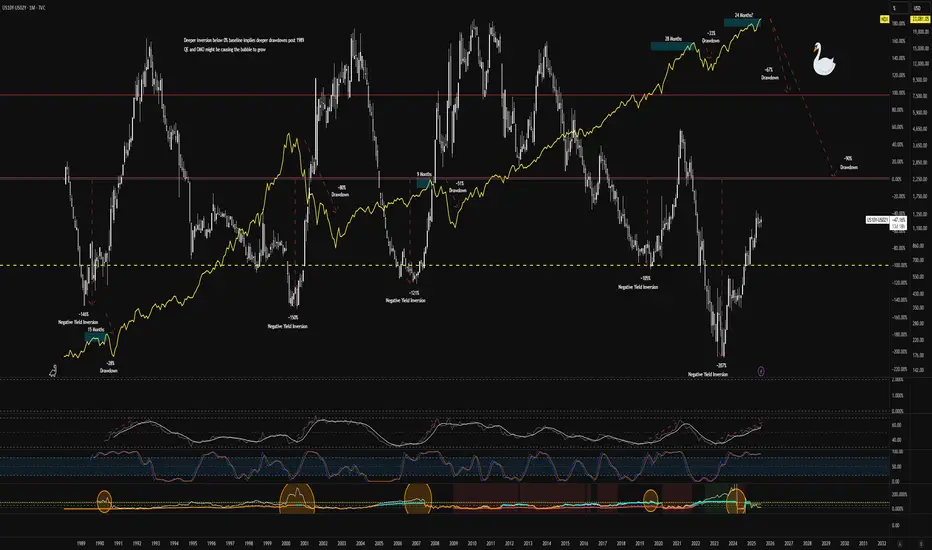
$NDX Black Swan Correlation of Variance from 0% of $US10Y $US02YIt appears that since 1989, deeper inversions of the yield curve have led to deeper drawdowns in the $NDX. Relative strength always appears to be in a steeper move upward coupled with fuzzy signals in volatility before the drawdown. Based on the previous market crashes, anything from a 60% to 90% drawdown appears to be plausible.
Currently buying long-expiry OTM put verticals across tech meme names (think NASDAQ:PLTR ) and potentially on some stalwart Mag7 tickers (maybe NASDAQ:META ) for pennies for potentially massive risk/reward paydays. Nothing more than a few grand, but I'm also long exposure to battery materials, hydrogen, and other energy plays. NASDAQ:ABAT NASDAQ:PLUG AMEX:WWR NYSE:LAC NASDAQ:ENVX NYSE:CHPT AMEX:LEU NYSE:SMR
Best of luck.

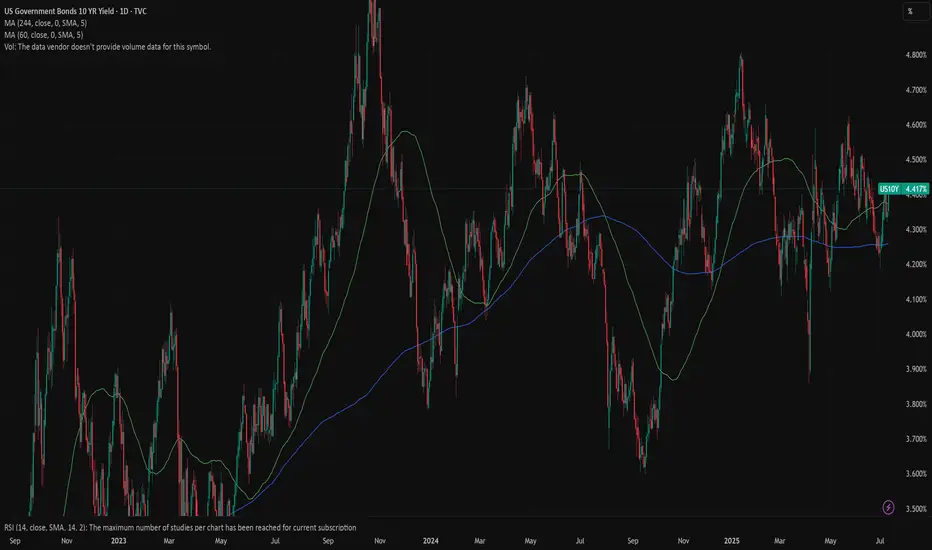
US10Y UNITED STATES GOVERNMENT 10 YEAR BOND YIELD.the US 10-Year Treasury Yield (US10Y) stands at 4.39%-4.5%,The 10-year yield is a key benchmark for long-term interest rates in the United States and is closely watched by investors as an indicator of market sentiment regarding economic growth, inflation, and Federal Reserve policy.
The yield has been rising recently, reflecting investor concerns about US fiscal policy, inflation, and the outlook for Federal Reserve rate cuts.
Federal Reserve Interest Rate Decision (June 2025)
The Federal Reserve held its key interest rate steady at 4.25%–4.50% at its June 2025 meeting.
This marks the fourth consecutive meeting with no change in rates, as the Fed continues its cautious, data-dependent approach amid persistent inflation and moderate economic growth.
The Fed’s latest “dot plot” and projections indicate that two 25-basis-point rate cuts are still possible by the end of 2025, but expectations for cuts in 2026 and beyond have been reduced.
Key Drivers and Outlook
Yield Movements: The 10-year yield has climbed amid concerns about US fiscal deficits, credit rating downgrades, and the impact of tariffs and trade policy on inflation.
Fed’s Tone: The FOMC statement and projections reflect ongoing stagflationary pressures—slower growth, persistent inflation, and a slightly rising unemployment rate.
Market Expectations: Markets are pricing in two rate cuts by year-end, most likely in September and December, but nearly half of Fed officials see little or no room for cuts in 2025 if inflation remains sticky.
Conclusion
The US 10-year Treasury yield remains elevated as markets weigh fiscal risks, inflation, and the Fed’s cautious stance.
The Fed is holding rates steady but signaling that two rate cuts remain possible in 2025, with future moves highly dependent on incoming data, especially inflation and labor market trends.
Investors should expect continued yield volatility as economic and policy uncertainties persist.

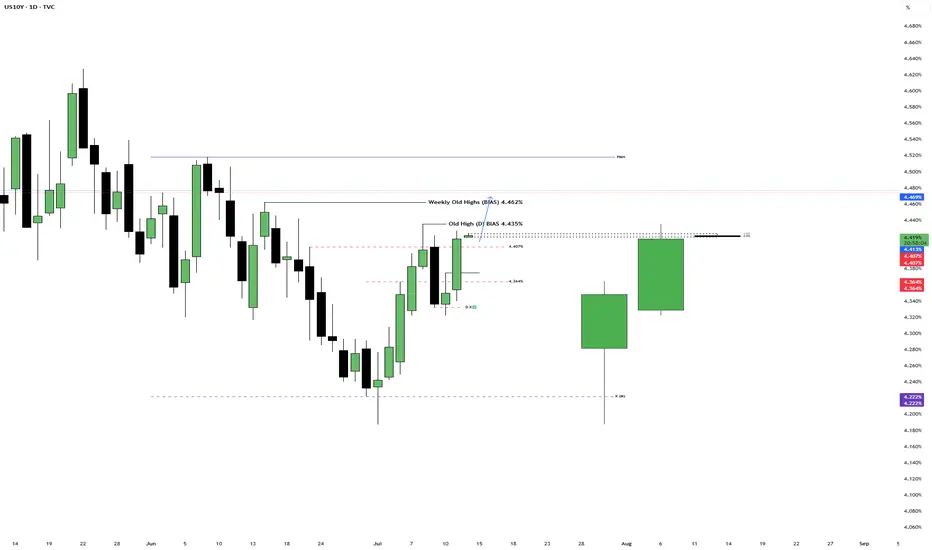
US Treasury 10Y Technical Outlook July 14-18 (updated daily)US Treasury 10Y Technical Outlook for the week July 14-18 (updated daily)
Overnight
On Friday, the US 10-year Treasury note yield increased by nearly 4 basis points to approximately 4.39%, driven by market concerns over new tariff threats from President Trump. These include a proposed 35% tariff on Canadian imports starting August 1, 2025, and planned 15-20% tariffs on most other trading partners, up from the current 10%. Additional tariffs include 50% duties on Brazilian imports and copper, alongside formal notices to other key trading partners, intensifying trade tensions. Despite these developments, the US Treasury reported strong demand for its recent auctions, with $22 billion in 30-year bonds and $39 billion in 10-year notes. On monetary policy, markets anticipate the Federal Reserve will maintain current interest rates at its next meeting, with expectations of two 25-basis-point rate cuts by the end of 2025. Source: TradingView News (Trading Economics)
Economic News for the week www.myfxbook.com
Daily Technical Outlook
With the strong bearish (in price) close on Friday and the week, there’s a chance market will target 4.435% and for the week 4.462%. With the strong influence by fundamental please continue to watch the tariff updates and policy adjustments as this are the strong drivers of market moves the past week. This week will be inflation rate week due on Tuesday.
**Disclaimer:**
The technical analyses provided herein are based solely on my personal analysis and are intended for my own study and reference. They do not constitute a recommendation or solicitation to buy or sell any financial instruments. Any decision made by individuals based on this analysis is their own responsibility, and I assume no liability for any losses or damages incurred as a result of using this information. It is advisable to conduct thorough research and consult with a qualified financial advisor before making any investment decisions.

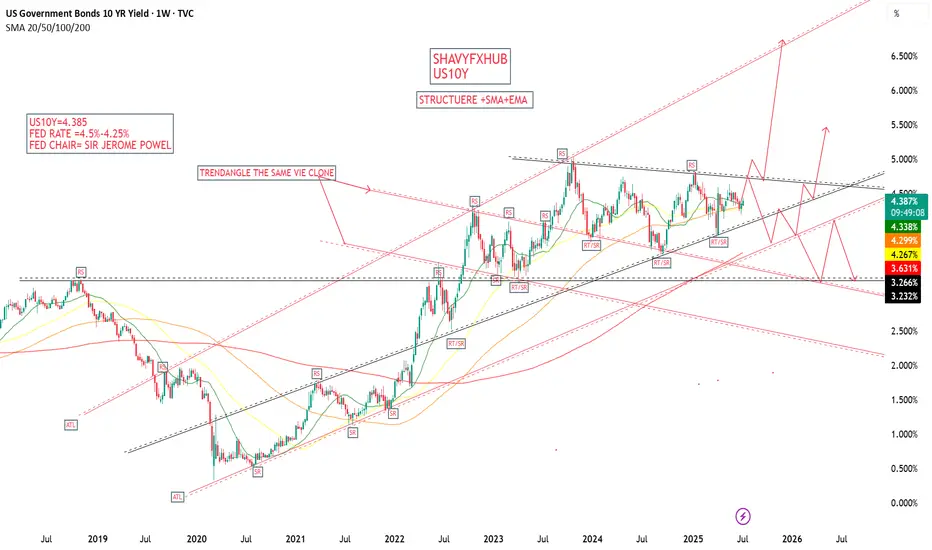
US10Y: New Multi Decade Highs are coming for Treasury Yields!📈 US10Y: Treasury Yields Are About to Explode Higher
Longing bonds was the consensus trade heading into 2025. Everyone expected a “flight to safety” as equities tanked, but guess what? Bonds have been a massive disappointment. Instead, Bitcoin and Gold have stolen that narrative—who saw that coming?
But here’s the real kicker…
The 10-Year Treasury Yield is now forming a textbook Wyckoff Distribution Schematic #2, and we’re entering Phase B with a potential Upthrust (UT) forming. That means yields could be gearing up for a massive breakout, putting serious pressure on leveraged bond bulls.
My projection?
We’re heading to the 2.272–2.414 Trend-Based Fib Extension, targeting 5.53% to 6.42%. That’s a multi-decade high in yields.
If you’re holding bonds with leverage...
🔥 You might want to sleep with one eye open.
And no—this isn’t about the Fed, or politics, or CPI print tea leaves. Fundamentals don’t lead—technicals do.

UNITED STATE GOVERNMENT 10 YEAR BOND YIELD US10Y1. US 10-Year Treasury Yield (US10Y)
The 10-year Treasury yield is approximately 4.39%, up about 0.04 percentage points from the previous session (July 10, 2025).
Over the past month, the yield has edged up slightly by around 0.02 points and is about 0.20 points higher than a year ago.
Market expectations project the 10-year yield to average around 4.28% by the end of Q3 2025, with a gradual decline to about 4.06% in 12 months.
The yield increase reflects ongoing market pricing of Fed rate policy, inflation expectations, and economic growth prospects.
2. US Dollar Index (DXY)
The DXY is trading near 97.758, reflecting a modest decline over the year.
The index is influenced by Fed policy expectations, global risk sentiment, and interest rate differentials.
A stronger 10-year yield tends to support the dollar, but recent tariff uncertainties and geopolitical risks have contributed to some volatility.
3. Bond Prices and PIMCO Active Bond ETF (BOND)
Bond prices move inversely to yields; with yields rising slightly, bond prices have shown minor declines.
The PIMCO Active Bond Exchange-Traded Fund (BOND) is trading around $91.50, essentially flat on the day, reflecting a diversified portfolio of fixed income instruments.
This ETF invests mainly in investment-grade debt but can hold up to 30% in high-yield securities, providing exposure to a broad range of bonds.
4. Federal Reserve Chairman
The current Chairman of the Federal Reserve is Jerome H. Powell, serving since February 2018 and reappointed in 2022 for a term through 2026.
Powell’s leadership continues to focus on balancing inflation control with economic growth, navigating trade uncertainties, and signaling a cautious but data-driven approach to future rate changes.
Summary Table
Metric Latest Data (July 2025) Notes
US 10-Year Treasury Yield 4.39% Slight increase; reflects Fed policy pricing
US Dollar Index (DXY) 97.75 Modest decline YTD; sensitive to yields and tariffs
PIMCO Active Bond ETF (BOND) $91.50 Stable; diversified fixed income exposure
Fed Chairman Jerome H. Powell Leading Fed policy since 2018, reappointed 2022
Market Context
The modest rise in the 10-year Treasury yield signals market confidence in the US economy but also reflects inflation concerns and Fed policy expectations.
The DXY’s relative stability amid tariff uncertainty suggests balanced market sentiment toward the dollar.
Bond investors remain cautious, with diversified funds like PIMCO’s BOND ETF offering a buffer against volatility.
Fed Chair Powell’s guidance continues to emphasize data dependency, with markets watching closely for signals on rate adjustments.
#FEDS #DOLLAR
US 10Y TREASURY: September rate cut?Jobs data posted during the previous week shaped investors sentiment. The JOLTs job openings in May reached the level of 7.769M, higher from market forecast of 7,3M. The main impact on the market came from the NFP data for June, with 147K new jobs, above market expectations of 110K. At the same time, unemployment fell to 4,1% in June. Strong jobs data significantly decreased market expectations that the Fed might potentially cut interest rates at July's FOMC meeting. Current odds still hold for September's cut.
A “higher for longer” is again wording used by market participants. The 10Y Treasury yields adjusted to that expectation by increasing yields from 4,2% toward 4,33% as of the end of the week. In a week ahead, there are no currently significant US macro data scheduled for a release. In this sense, it could be expected a short relaxation of the 10Y yields, where levels between 4,3% and 4,8% could be shortly tested.
UNITED STATES 10 YEAR GOVERNMENT BOND YIELD US10YMarket Context
The yield reflects investor expectations for Federal Reserve policy, inflation trends, and US fiscal conditions.
Markets are pricing in potential Fed rate cuts later in 2025, but persistent inflation and fiscal concerns are keeping yields and pending a clear directional bias .
The US 10-year yield is a key benchmark for borrowing costs and is closely watched as a “risk-free” rate for global financial markets.
Summary
US10Y is currently at 4.35%-4.332%,
The yield awaiting further economic data and central bank signals.

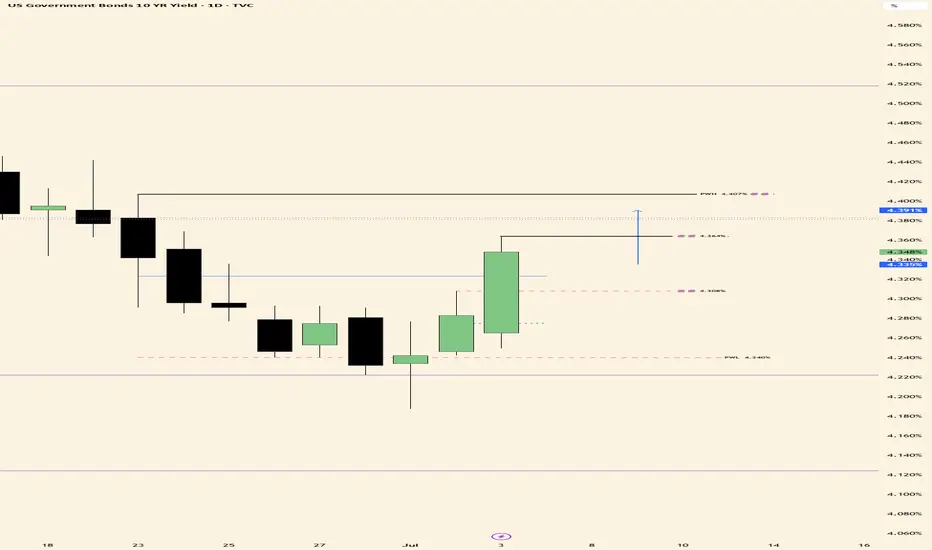
UST 10Y Technical Outlook for the week July 7-11 (UPDATED DAILY)US Treasury 10Y Technical Outlook for the week July 7-July 11 (updated daily)
Overnight
The US 10-year Treasury yield increased by 6 basis points to 4.34%. A stronger-than-expected jobs report triggered the rise. Nonfarm payrolls reached 147,000 in June. April and May payroll figures were revised higher. The unemployment rate dropped to 4.1%. Wage growth slowed to 0.2%. Investors eliminated expectations for a July Federal Reserve rate cut. The probability of a September rate cut fell to approximately 80%. Fed Chair Powell advocated a cautious approach. A significant bill advanced through Congress.
Source: TradingView News (Trading Economics)
Economic Release week July 7-11 www.myfxbook.com
Technical Outlook
Monthly Chart, I am expecting a support (in px) at 4.37%, the 50% fib level of previous month. If it continuous to punch through then I would expect a target of previous month high of 4.518% is in play. Weekly Chart, following a sweep of previous week low with strong rejection, I am expecting market to target previous week high (PWH) of 4.407%. It is also worth to note that the week is closing above 50% range of last week with no signs of rejection. Daily chart, , yesterday I mentioned “ wich leads me to expect a continuation to target yesterday’s high of 4.308%” the lvl was reached and market closed through the previous day’s high which leads me to expect the next daily target will be
**Disclaimer:**
The technical analyses provided herein are based solely on my personal analysis and are intended for my own study and reference. They do not constitute a recommendation or solicitation to buy or sell any financial instruments. Any decision made by individuals based on this analysis is their own responsibility, and I assume no liability for any losses or damages incurred as a result of using this information. It is advisable to conduct thorough research and consult with a qualified financial advisor before making any investment decisions.
US 10Y TREASURY: jobs data aheadThe Fed's favorite inflation gauge was posted during the previous week, which impacted some higher volatility in the U.S. Treasury yields. The Personal Consumption Expenditure index ended May by 0,1% higher from the previous month, bringing the index to the level of 2,3% on a yearly basis. The core PCE remained a bit elevated with 0,2% in May and 2,7% for the year. Still, both figures were in line with market expectations, which was the main reason for 10Y U.S. Treasury benchmark yields drop to the level of 4,25% at the end of the week, from 4,40% where the week started.
A drop in inflation figures are increasing market expectations that the Fed might cut interest rates in September. However, a week ahead might bring again some higher volatility in the U.S. Treasury yields as the major jobs data will be posted. For the week ahead the JOLTs Job Openings, the Non-farm Payrolls and the June unemployment will be posted. Considering Fed's dual mandate, bonds market participants will be closely watching these data.

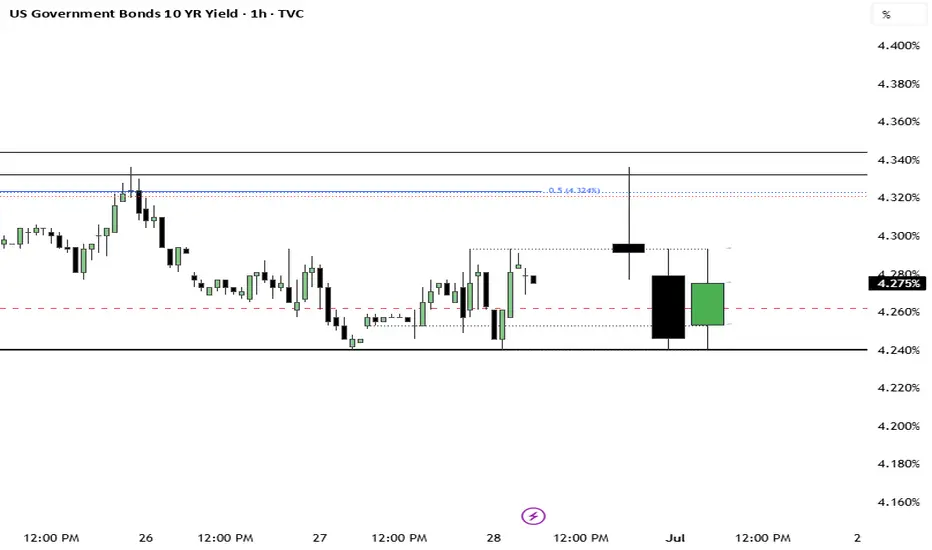
US Treasury 10Y Technical Outlook June 30-July 4 (Updated Daily)US Treasury 10Y Technical Outlook June 30-July 4
Overnight
On June 27, 2025, the US 10-year Treasury yield rose to 4.26% after five sessions of decline, as markets anticipate earlier Fed rate cuts. Recent data, including subdued PCE inflation, a sharp drop in May consumer spending, a 0.5% Q1 GDP contraction, and rising jobless claims since 2021, support these expectations. Fed Chair Powell’s dovish congressional remarks and potential new Fed leadership by September or October further bolster a dovish policy outlook.
Economic Release for the Week www.myfxbook.com
Technical Outlook
On the monthly chart, , we can see that price is trading below the 50% level of the previous month’s, May, range showing bullishness in price. Weekly chart, , we can see the previous week low (PWL) has been broken and closed through suggesting the yield could continue to fall and im looking at 4.24% as a target for the week. Daily Chart, we can see that it did not break Thursday’s low instead priced bounced and gave a green candle. This tells e that there’s a possibility of a technical correction. Im looking at the daily supply area (D -OB 4.332%) for a possible target.
**Disclaimer:**
The technical analyses provided herein are based solely on my personal analysis and are intended for my own study and reference. They do not constitute a recommendation or solicitation to buy or sell any financial instruments. Any decision made by individuals based on this analysis is their own responsibility, and I assume no liability for any losses or damages incurred as a result of using this information. It is advisable to conduct thorough research and consult with a qualified financial advisor before making any investment decisions.
US10Y & ZB1! (Bonds) Weekly AnalysisUS 10‑Year Treasury Yield (US10Y)
The 10‑year yield ended last Friday (June 27, 2025) at 4.27%
After peaking above 4.46% mid‑week, yields eased late‑week as markets increasingly priced in potential Fed rate cuts—a 25 bp move in July was seen at 22.7% probability, up from ~14%
This dovish shift, alongside a softer May PCE print, supported a lull in yield increases
Still, Inflation concerns and record debt issuance continue to underpin a term premium on long-duration debt
ZB1 – 30‑Year Treasury Bond Futures
The September‑expiry T‑Bond futures (ZB1) which trade inversely to yield, saw modest price appreciation, reflecting falling yields.
Futures prices responded to the dovish Fed tone and easing global tensions, aligning with stock market gains.
The spread between 10‑ and 30‑year yields widened to ~56 bp—the largest since late 2021—illustrating increased yield curve steepening, mirrored in futures.
------------------------------------
I will be approaching the markets differently from now on.
Based on the feedback from past analysis, I will be compiling all related pairs into one video, giving you guys the ability to see how one asset affects the other.
This is called inter-market relationship and it's something i've been doing for years.
It gives you confidence on what pairs are 'Hot Picks' and the ones that have a high chance of not delivering the way you want.

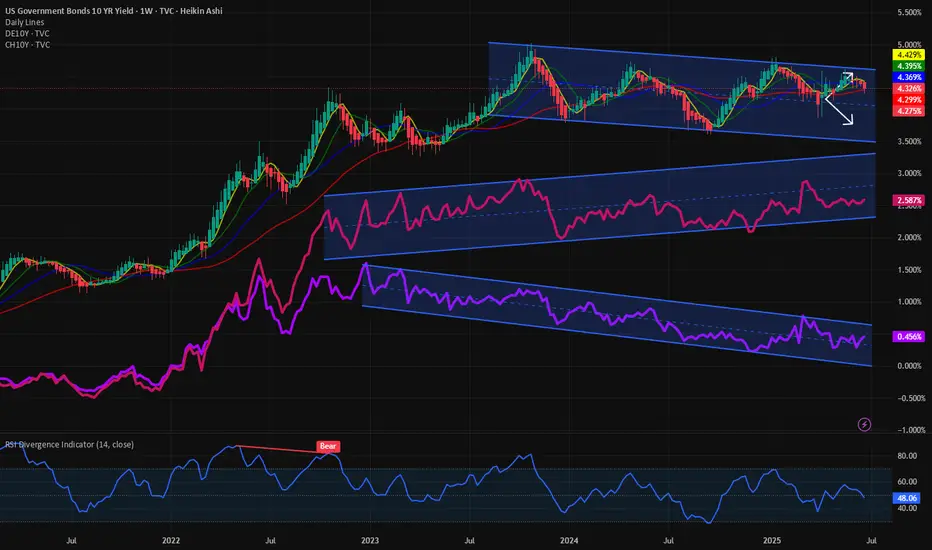
Price of fiscal profligacy: US10Y vs DE10Y vs CH10Y Today I will go unconventional in my analysis and look at the yields of 3 major economies with 3 different fiscal trajectories. Today we look at the 10Y Yield of US, Germany and Switzerland. 3 different countries with different Fiscal and Monetary policies off late.
The TVC:US10Y after touching the highs of 5% in Oct 2023 has been in a downward trend making new lower highs and lower lows but within the downward slopping channel sweeping the upper bound and the lower bound. Recently, touching the higher bound of the channel at 4.5%, since then it has reversed its course and gone down. On 26th May my article on TVC:US10Y and TVC:DXY forecasted 4.6% as the upper bound for the $US10Y. TVC:US10Y and TVC:DXY Divergence and correlation breakdown for TVC:US10Y by RabishankarBiswal — TradingView . We recently got rejected at 4.51%. So, the obvious direction for TVC:US10Y is lower with 3.5% as the lowest target.
Now switching gear to $DE10Y. The German Bunds are doing the reverse. They are making a series of new higher highs and higher lows. With increasing yields on the TVC:DE10Y and fiscal indiscipline on the part of German govt this is going to rise in the medium to long term.
Then we finally look at the Swiss 10Y which might touch ‘Negative’ in the near term. The Swiss central bank is on the path to reduce the rates to negative in Sept 25 meeting. The TVC:CH10Y at 0.45% brings back the memory of negative rates. But with global flight to safety and a fiscally conservative government the TVC:CH10Y is in huge demand hence pushing down the yields.
Verdict : TVC:US10Y ↘ between 4.3% - 3.5%, TVC:DE10Y ↗ between 2% - 3%, TVC:CH10Y TVC:US10Y ↘ between 0.5% - (- 0.25%)
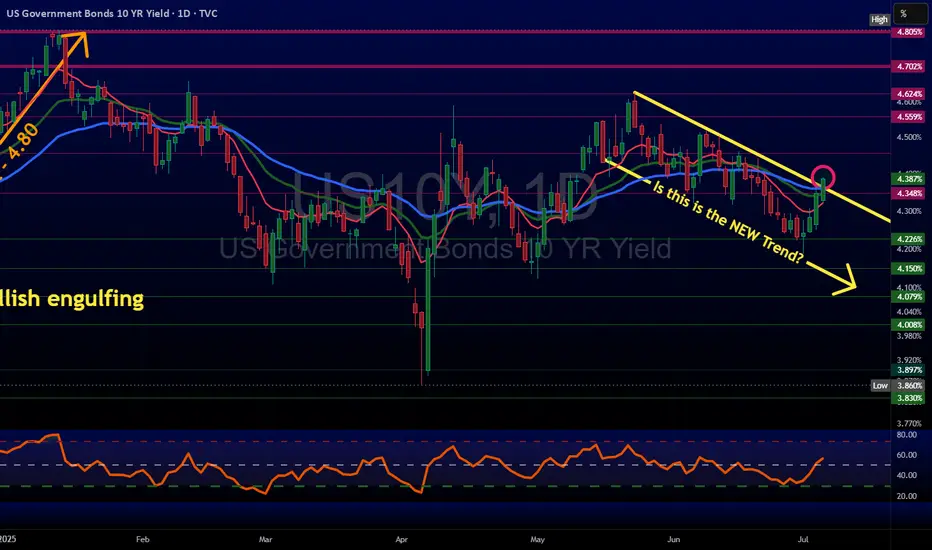
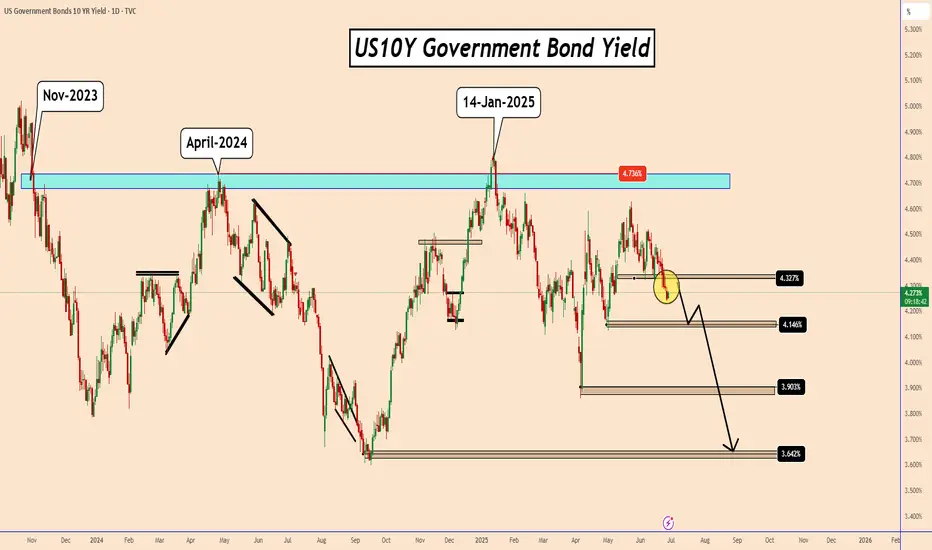
US10Y: Signals Deeper Drop as Rate Cut Hopes BuildUS10Y: Signals Deeper Drop as Rate Cut Hopes Build
The U.S. 10-Year Treasury Yield (US10Y) has broken decisively below a key daily structure zone near 4.32%, marking a significant technical breakdown. If price action holds beneath this level, it increases the probability of a further slide toward 4.14% and potentially 3.09%—levels last seen in early April 2025.
From a broader perspective, the yield could eventually decline toward 3.64%, dating back to early September 2024.
This bearish momentum may begin unfolding today, especially if the PCE data hints at a potential Fed rate cut. During recent testimonies, Chair Powell emphasized a data-dependent approach, yet didn’t dismiss the possibility of a rate cut in the July meeting.
Interestingly, despite US10Y's decline, it may still provide temporary support for the U.S. dollar (USD) in these volatile conditions. The correlation between US10Y and the USD has weakened in recent months. Let's see what happens.
You may find more details in the chart!
Thank you and Good Luck!
PS: Please support with a like or comment if you find this analysis useful for your trading day
US GOVERNMENT 10 YEAR BOND YIELD.The correlation between the US 10-Year Treasury yield (US10Y) and gold prices is historically inverse but has shown periods of divergence due to shifting market dynamics
1. Typical Inverse Relationship
Gold and US10Y yields traditionally move in opposite directions due to:
Opportunity Cost: Higher yields increase the cost of holding non-yielding gold, pressuring prices.
Real Interest Rates: Gold tends to fall when real yields (nominal yield minus inflation) rise, as seen in pre-2024 data.
2. Recent Deviations and Drivers Since 2024, this correlation has weakened or reversed under specific conditions:
Geopolitical Turmoil makes Positive correlation (both rise)us10y and gold ,eg Russia-Ukraine war, Middle East tensions, and U.S.-EU tariffs drove simultaneous surges in yields and gold as dual safe havens.
De-Dollarization,Gold decouples from yields as mejor Central banks (e.g., China, Russia) bought gold aggressively, offsetting yield-driven pressure.
3. Yield Level: US10Y at 4.26%,
Correlation Status: Weakly inverse, but fiscal risks (e.g., U.S. deficit, trade policies) could reignite positive links.
Key Influencers Moving Forward
Fed Policy: Expected rate cuts (2×25 bps in 2025) may weaken yields, boosting gold.
Inflation Expectations: Sticky inflation could sustain gold’s appeal despite yield fluctuations.
Geopolitics: Escalations in trade wars or conflicts may re-tighten the positive correlation.
Summary
While the US10Y-gold correlation remains fundamentally inverse, recent structural shifts—geopolitical stress, fiscal uncertainty, and de-dollarization—have driven periods of alignment.
#dollar #gold


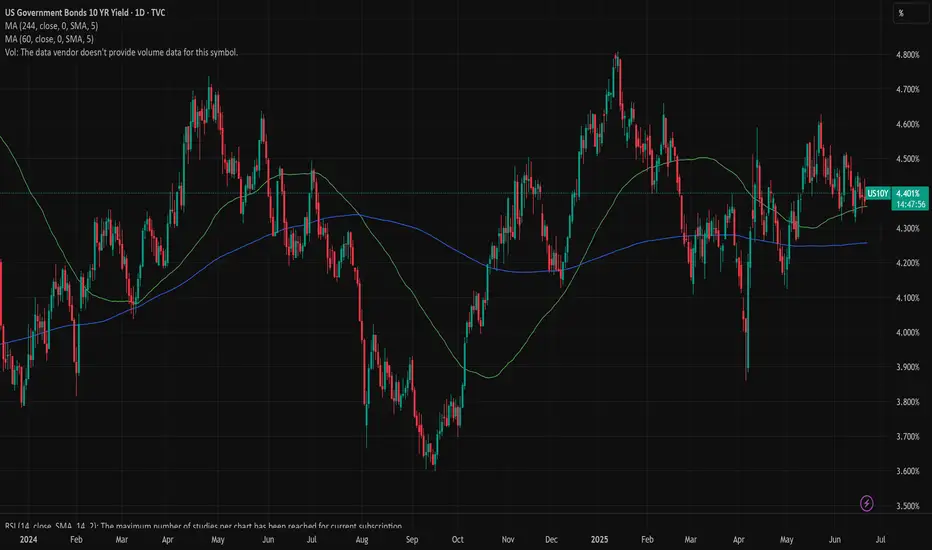
US10YAs of June 23, 2025, the US 10-year Treasury yield is 4.40%, reflecting a slight increase from the previous session. Recent data from June 20, 2025, showed the yield at 4.38%, and it has hovered in the 4.3%–4.5% range throughout June. This level is above the long-term average of around 4.25%.
The uptick in yields is driven by investor concerns over US fiscal policy, a growing budget deficit, and recent credit rating actions. Federal Reserve officials have also highlighted risks related to the labor market and inflation, with markets currently pricing in two possible 25-basis-point rate cuts by the end of the year.
Summary:
US 10-year Treasury yield (June 23, 2025): 4.40%
Recent range (June 2025): 4.3%–4.5%
Drivers: Fiscal concerns, inflation expectations, and Fed policy outlook
This yield is closely watched as a benchmark for global interest rates and risk sentiment.

US 10Y TREASURY: digesting FOMC ahead of PCEThe central event for financial markets during the previous week was the FOMC meeting. The Fed decided to hold interest rates at current levels, but two rate cuts till the end of this year are still on the table. This was in line with market expectations. Still, the Fed Chair Powell shortly commented on the potential for higher inflation in the coming period, as a reflection of implemented trade tariffs of the US Administration. The Fed is expecting to see it reflected in the inflation figures in the future period, but they will continue to be data-driven when deciding on interest rates.
Due to the FOMC meeting, the 10Y Treasury benchmark was moving with a higher volatility during the week, as was expected. The nervousness regarding Fed's next move on interest rates was high for some time in the past. The 10Y yields started the week around the 4,5% while ending it at 4,37%. The PCE data are scheduled for a release in the week ahead. If there are no surprises with the data, it could be expected that 10Y yields will have a relatively calmer week, with further relaxation in yields, moving above the 4,3% level.
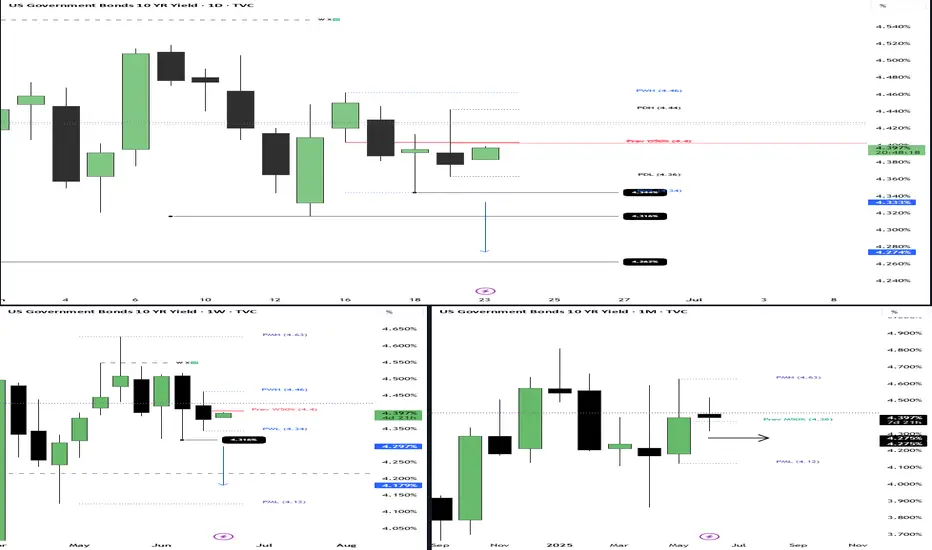
US 10Y TECHNICAL OUTLOOK FOR THE WEEK JUN 23-27 (UPDATED DAILY)US 10Y TECHNICAL OUTLOOK FOR THE WEEK JUN 23-27 (UPDATED DAILY)
Geopolitical event
Early Monday in Asia, US equity futures fell and oil prices surged following US strikes on Iran's nuclear facilities over the weekend, prompting a risk-off sentiment that saw Asian equities decline and the dollar strengthen against major currencies. The US Treasury market faced pressure as investors anticipated heightened geopolitical uncertainty, with some expecting a flight to safety that could increase demand for Treasuries and push yields lower. However, concerns over potential oil supply disruptions and rising inflation risks could elevate real yields, potentially pressuring Treasury prices. Analysts suggest that while Treasuries may see initial safe-haven buying, sustained oil price spikes could complicate the Federal Reserve’s inflation outlook, impacting Treasury yields. The uncertainty surrounding Iran’s response and the risk of further escalation, particularly in the Strait of Hormuz, may continue to weigh on the Treasury market as investors reassess global economic implications.
Economic Releases for the week www.myfxbook.com
Technical outlook
For the monthly we maintain to be constrained within the previous month’s range as long as we don’t see any break from the range I will call the monthly range sideways. Weekly I would like to see a break below 4.316% to be bullish otherwise sideways. A break below 4.316% I will be looking at previous month low as a target. For the daily I would lie to wait how the market digests the ongoing Iran strike by the US for direction. But a break below 4.344% could be a bullish sign for me.
US10Ythe US 10-Year Treasury Yield (US10Y) stands at 4.39%-4.5%,The 10-year yield is a key benchmark for long-term interest rates in the United States and is closely watched by investors as an indicator of market sentiment regarding economic growth, inflation, and Federal Reserve policy.
The yield has been rising recently, reflecting investor concerns about US fiscal policy, inflation, and the outlook for Federal Reserve rate cuts.
Federal Reserve Interest Rate Decision (June 2025)
The Federal Reserve held its key interest rate steady at 4.25%–4.50% at its June 2025 meeting.
This marks the fourth consecutive meeting with no change in rates, as the Fed continues its cautious, data-dependent approach amid persistent inflation and moderate economic growth.
The Fed’s latest “dot plot” and projections indicate that two 25-basis-point rate cuts are still possible by the end of 2025, but expectations for cuts in 2026 and beyond have been reduced.
Key Drivers and Outlook
Yield Movements: The 10-year yield has climbed amid concerns about US fiscal deficits, credit rating downgrades, and the impact of tariffs and trade policy on inflation.
Fed’s Tone: The FOMC statement and projections reflect ongoing stagflationary pressures—slower growth, persistent inflation, and a slightly rising unemployment rate.
Market Expectations: Markets are pricing in two rate cuts by year-end, most likely in September and December, but nearly half of Fed officials see little or no room for cuts in 2025 if inflation remains sticky.
Conclusion
The US 10-year Treasury yield remains elevated as markets weigh fiscal risks, inflation, and the Fed’s cautious stance.
The Fed is holding rates steady but signaling that two rate cuts remain possible in 2025, with future moves highly dependent on incoming data, especially inflation and labor market trends.
Investors should expect continued yield volatility as economic and policy uncertainties persist.