Why are Interest rates falling? Time to buy? We have seen an amazing fall in interest rates.
Bonds have looked to put in a local bottom.
Why are bonds showing signs of accumulation?
Is the bond market pricing in a recession?
I believe the recent decline in yields is due to commodity weakness.
Yields have soften because energy & base metals have become cheaper.
This drives the disinflationary narrative.
I think its to early to tell whether this decline is from demand or global weakness.
US Government Bonds 10 YR Yield
4.420%R
−0.054−1.21%
Yield
%
No trades
98'20'6% of parR
+0'13'6+0.43%
Price
US10Y trade ideas


Rate Cut? Big Disappointmenting, Unlikely!US10Y Yield Drama: The US 10-Year Yield has been on a rollercoaster—recently dipping, then bouncing back like it’s trying to make up its mind. But let’s be real, being around 4% isn't exactly an invitation to rate cuts.
History’s Not on Your Side:
Sure, the Fed has cut rates before without a crash, but that was when inflation wasn't hanging around like an uninvited guest.
Remember 1998 or 2001? Yeah, those were different times. Now, we've got inflation breathing down our necks.
What’s Really Going On:
This yield isn’t breaking any new ground—bouncing between 4.5% and 3.5% like a broken record.
Everyone’s screaming about an inverted yield curve, but hey, what else is new? We’ve been hearing recession alarms for a while now, and still, no rate-cut savior.
Fed’s Big Non-Move:
The Fed's been singing the same old tune—committed to that elusive 2% inflation target like it’s a sacred mission. They’re not about to abandon ship just because the market’s getting a little choppy.
Meanwhile, Japan hit the reverse button on their rate hike decision. The markets caught their breath, and we’ve already seen some solid “buy the dip” action. Panic averted—for now.
Even with the VIX spiking from all the fear trades, don’t be surprised if it calms down soon. The market’s got a short memory, and we’re likely headed for a higher high once this storm passes.
Cutting rates now would be like pouring gasoline on a fire and hoping for rain. Not happening.
Bottom Line: The US10Y might be teasing you with the idea of a rate cut in September, but don’t hold your breath. The Fed’s playing hard to get, and unless the economy really goes south, they will not lower the interest rates.
Reversion Zones:
Being back to 4% is a very high probability
4.35% will be soon after

US10Y - Stance Resistance @ 4.249%. Will It Break?Smooth edges loves to become jagged in the market and with 4.249% being a weekly double top, this could potentially entice more short traders into the market as the logic is 'sell resistance, buy support'
I go against that logic so 4.282 - 4.288 will be the next draw on liquidity if we are to see a continuation to the upside

Critical Resistance Ahead for US 10-Year Yield: Key LevelsWe've observed an impressive corrective rebound in the US 10-year yield chart. However, we are now approaching a significant resistance zone between 4.06% and 4.09%. This area marks the point where the yield previously broke out of its channel, aligning with the highs seen in March and July of 2023. Additionally, this zone represents the 38.2% retracement of the entire decline from the April 2024 peak to the August low. With this confluence of resistance levels, we will be closely monitoring for any signs of failure.
Disclaimer:
The information posted on Trading View is for informative purposes and is not intended to constitute advice in any form, including but not limited to investment, accounting, tax, legal or regulatory advice. The information therefore has no regard to the specific investment objectives, financial situation or particular needs of any specific recipient. Opinions expressed are our current opinions as of the date appearing on Trading View only. All illustrations, forecasts or hypothetical data are for illustrative purposes only. The Society of Technical Analysts Ltd does not make representation that the information provided is appropriate for use in all jurisdictions or by all Investors or other potential Investors. Parties are therefore responsible for compliance with applicable local laws and regulations. The Society of Technical Analysts will not be held liable for any loss or damage resulting directly or indirectly from the use of any information on this site.


Inverted Yield curve re-inversion vs SPYSince 1990, there has been a 4/4 probability of market declines and recession proceeding the re-inversion.
For data not shown on Tradingview, there were 2 outliers in 1980 and 1982 where the market nearly bottomed as it re-inverted (fred.stlouisfed.org/series/T10Y2Y)
However, the last two re-inversions still had the market increase for the proceeding 24 weeks (5-6 months). This is very important information. If this cycle plays out like the last 2, the markets might still crawl higher until Jan 2025.

Yield curve re-inversion vs GoldAs the yield curve re-inverts, it presents an opportunity for safe haven assets like gold to outperform. The only outlier was 1980 and 1982 when gold had already increased 800% in the few years prior due to Fed Volcker's era of runaway inflation.
Evidenced by the inverted yield curve's track record of predicting recessions, the Sahm Rule was also triggered on Friday's unemployment data. Since 1950, the Sahm Rule was able to predict a recession 10/11 times (91% chance). Every time it did predict a recession, it did so within 4 months.
Coincidentally, This time frame fits quite nicely with the 24 weeks of upside proceeding the re-inversion before the start of a bear market

US10Y Government Bond Yield Could Test 3.9% SoonUS10Y Government Bond Yield Could Test 3.9% Soon
The price is showing the completion of a complex pattern that could push the price further.
A very strong resistance area over the previous weeks is found near 4.48% dating back almost 1 month
Also considering overall market expectations, US CPI data on Thursday could help this bearish move.
You may find more details in the chart!
Thank you and Good Luck!
❤️PS: Please support with a like or comment if you find this analysis useful for your trading day❤️

Bearish Yields Can Send USDollar Lower10Y US Yields are falling impulsively within wave C as expected after we noticed sharp leg down into wave A, followed by a corrective rally in wave B. So, there can be now space even down to the former wave 4 area at 3.25%. If we consider a positive correlation with USdollar Index – DXY, then USD can face more weakness. Is DXY trying to break bearish triangle?

Yield CurveThe 2/10 treasury yield spread is quickly flattening and an inversion could happen soon.
All of the previous yield curve inversions are associated with memorable market sell-offs and recessions.
I believe the ripple effect of the ongoing financial and economic sanctions against Russia will end up being the catalyst for the next meltdown.
The market conditions have been favorable to a disaster by many measurements for some time now.
Again, there are many unknown cross-currents beginning to work their way into the global economy. On top of that, the FED is raising interest rates in less than two weeks.

Yield Curve touched the 0% - Will it continue up?US10Y-US02Y = Yield Curve.
The Yield Curve has predicted each of the previous market crashes.
The markets are crashing now but is it really the beginning of a bigger market crash?
OR are the markets just very volatile and have more last push up? Maybe yes for the US Markets.
In 2000, the market peak was when the yield curve was still negative (-0.3%).
In 2007, the market peak was when the yield curve was at 0.5%.
Is 2024 more like 2000 or 2007?

US 10Y TREASURY: September?During the previous week the 10Y US benchmark rates reached the lowest weekly level at 3.78%, and moved down from the support line at 4.2%. There are two major reasons for such a strong drop in Treasury yields. The first was on Wednesday when Fed Chair Powell noted a potential for a rate cut in the future period, which market perceives to be September`s FOMC meeting, and the second reason was surprisingly weak jobs data posted on Friday. The posted non-farm payrolls for July were significantly weaker from market expectations, reaching 114K, from 175K expected by the market. At the same time, the unemployment rate reached 4.3%, again higher from 4.1% estimated by the market. There is currently fear among investors that the US might slip into recession, however, there are also analysts who are noting that weak figures might be due to seasonal effects. Surprisingly weak jobs data led investors to increase odds for more than one rate cut during the course of this year. Also, there is currently 58% chances by market expectations, that the Fed will cut rates by 50 basis points.
After such a strong move in Treasury yields, it could be expected that the market will slowly digest the Friday`s data and adjust positions accordingly. In this sense, there is a probability that the yields would revert a bit to the upside, at least to the level of 3.9%. However, at this point levels around 4.0% are questionable.


US10Y - 7 Days Of Hell! When Will It End!?The FED has maintained their stance with 5.50% whilst BOE and several others have either lowered interest rates by .25 basis points or raised it.
Due to this, we have seen turmoil in the yield markets, -11%* decline within 7 days with more potential pain to come.
Current price action is trading below 2024's lows which could be a factor, if short-term trading to capture relief rallies back up to PD arrays.
3.783 is the next draw on liquidity.
Set a alert!
Monthly/Weekly buyside imbalance sellside inefficiency + order block located @ 3.644 - 3.535 is the next potential draw over the monthly basis

US 10 year Bond BoxesAll horizontal rectangles edges are Levels I will be watching for potential support and resistance action. Wouldn't say I am overly confident in the potential colored path of the boxes (red, cyan, yellow, pink and blue), but will provide step by step updates if anything significant pops up in a discretionary perspective.
The project should or might become more relevant with it's levels and zones, in time, if we get to see specific price action at the levels to indicate at least a slight sign of relevance.
First one to look out for is potential support at the red zone. Next to watch out for is a bullish toned cyan box perspective. If these fail, all bets are not off, we just let the price action dictate how the market feels inside the boxes and what it does when it escapes one.
Thinking outside of the box there might be another potential aspect for this project. What if the information is encrypted so that we don't get to see in advance what can really actually happen? How can we crack the code and why? Take a deep breath. Get A Touch of Zen. Look at the design without having thoughts about it and see what pops up and why and how. I like the O icon and the nen text location. Could be wrong though.
This one is similar to the EURUSD project. Linked.


How I Stay Organized and Efficient During My Morning RoutineGood morning, traders! ☕️ As I gear up for the trading session, here's how I stay organized and efficient during my morning routine:
1️⃣ Plan the night before: I prep my trading station, review market news, and outline my trading goals before calling it a day. This sets a clear roadmap for the morning and reduces decision fatigue.
2️⃣ Start with a ritual: I kick-start my morning with a ritual that helps me get focused and energized. Whether it's meditation, visualization, exercise, or enjoying a cup of coffee/tea, this routine primes my mind for the challenges ahead.
3️⃣ Time blocking: I allocate specific time slots for key activities like fundamental and sentiment research, top down technical analysis, bias matrices, reviewing trade setups, and analyzing charts. This helps me stay on track, avoid distractions, and make the most of my pre-session hours.
4️⃣ Utilize checklists: I have a checklist that outlines essential tasks like reviewing economic data, assessing overnight market developments, rebalancing portfolio and updating my watchlist. If I have anything specific I need to focus on that session, I will take note too. This ensures I don't miss important steps or actions/tasks.
5️⃣ Stay organized digitally: I leverage technology tools like trading journals, note-taking apps, and calendar reminders to keep track of my trade ideas, record observations, and stay organized. This digital approach streamlines my workflow most of the time.
6️⃣ Focus on self-care: Prioritizing self-care is vital for optimal performance. I make sure to nourish my body with a healthy breakfast, hydrate adequately (especially important during the extended heat waves I experience where I live), and take short breaks to relax and recharge. A balanced mindset is key to success.
Finding an efficient morning routine is a personal journey. Experiment with different strategies, listen to your needs, and fine-tune your routine over time. Start your day right and set yourself up for trading success! 📈✨

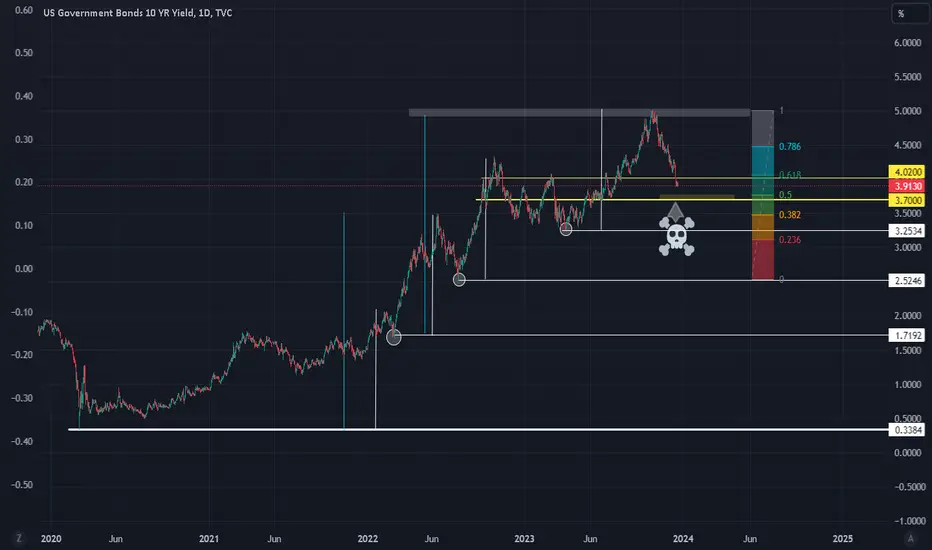
US10Y : What/where to look The Fed say don't worry, things are looking good. There is 'no landing'. So lets be happy and continue as usual. The stocks are riding high. Jobs are plenty. Surely things are fine.
But the MARKET says other wise. Above is a simple way of looking at it. The market looks like it is scared shit and continue to buy up longer term bonds. If you look closely, 3.70% is the line separating heaven and hell. I am sitting back until it falls below, then it should be time to begin trading - unlike many who shorted way too early.
Why 3.70%? Look closely.
When something is going to break, it is usually the 'structure' - and the whole house of cards will fall down - in an instance :)
Good luck.
The yield Curve almost Inverted again while Inflation soaredThe yield Curve almost Inverted again while Inflation soared. The worst thing for the risk assets like equity is full of participants who now need to face the Fed Fund Rate being hiked up by the Fed, which is currently under more pressure to increase Fed Fund Rate against higher Inflation which is 8.6% released this week. In contrast, the 2-year bond yield goes up this week.
That means three things:
1. The higher rate, the higher the "cost of money" - Bad things for Risk Assets
2. The spread of 10 yr treasury yield minus 2 yr treasury yield almost goes down to negative, which means short-term bond yield has potential higher than long-term. Once 10yr-2yr is negative, the inverted yield curve occurs.
3. the S&P 500's chart is now like 2008; the former is a Head & Shoulders, and the latter was a Double-TOP.
We are probably already in the worst stock market condition since the global financial crisis of 2008-2009. Whether the Fed will increase its rate or not, the stock market needs to pay back since the Fed printed a lot of money to "save" the market in early 2020. Conservatively, I won't say that the U.S. economy is plunging into a recession right now, but at least the stock market's value is into a contraction in advance. The exogenous factors like Ukraine War and China's lockdown are affecting the manufacturing of the USA. Inflation is now causing the consumption problem in such an environment, the U.S. Saving Rate is going down, and the PCE is. But if you look back in 2009 and 2019-2020, while the PCE was going down, the U.S. Saving Rate was going up, which means that the consumers in the U.S. still had spending power, unlike this time.

US 10Y TREASURY: the FOMCDuring the previous week markets full attention was on PCE data which were published on Friday. The PCE index rose 0.1% for the month, and 2.5% on a yearly basis, which was fully in line with market estimates. The evident slowdown in inflation in the US increased the probability that the Fed might make the first cut in September this year. The 10Y US benchmark yields were reflecting the investors sentiment during the week, moving from 4.3% at the start of the week, and ending it at 4.19%.
As the FOMC meeting is scheduled for the week ahead, some increased market volatility is quite expected. Market is not expecting that the Fed will cut rates during this meeting, however, any change in rhetoric of the Fed Chair Powell might trigger higher market volatility. At this moment, there is a high probability that the market will test 10Y yields for a potential for lower grounds from the level of 4.20%. Some short move to the levels above 4.20% is also possible, but these levels are not expected to hold for a longer period of time.

A Recession Is Coming - Brace for Impact First things first
What is a Recession?
A recession is a period when the economy isn't doing well. It means businesses are selling less, people are losing jobs or not getting raises, and overall, there's less money being spent. It's like a slowdown in the economy where things are not growing, and sometimes they shrink. This period of economic decline usually lasts for a few months or longer. Usually, when we have two consecutive quarters of negative Gross Domestic Product (GDP) we say that we are in a recession.
Now, let's look at previous recessions to see if we can find some patterns that help us predict the coming one. 😊
This is how you can navigate through the chart:
- past recessions are highlighted with orange colored boxes based on the data from "FRED economic data".
- The purple line chart shows the US inflation rate.
- The US GDP is shown in a green step-line chart.
- The US interest rate is shown with an orange line.
- The Yellow line chart shows the unemployment rate in the US.
- The most important line chart here is the blue one that shows the spread between the 10-year bond yield and the 3-month bond yield (Yes we could also use 2-year instead of 3-month).
This blue line, the yield curve, is important to us because it's a reliable indicator that almost every time gave us a heads up for a recession (if you were looking at it of course 😁). When it falls below zero, we call it the inverted yield curve and we hit a recession almost every time it gets back up after spending some time below zero.
An inverted yield curve tells us that the market participants are concerned about future economic growth It can lead to tighter financial conditions, reduced lending, and lower consumer and business spending, which can contribute to a downturn in the economy.
With that said, take a look at the chart and you can easily spot the repetitive pattern of interest rate hikes/cuts, unemployment rate, and the inverted yield curve just before each recession.
With the strong possibility of having the first rate cut in September, and the patterns you see on the chart, can you say that we are going to have a hard landing and a recession? I would say yes.
If you say we are not going into a recession and your counter argument is backed by a low unemployment rate and a positive GDP and a declining inflation rate, this chart does not support the idea.
I know there are other factors that might support the soft landing scenario, and I would like to have your point of view on this. So, please share your thoughts in comments section if you are reading this post through Tradingview. 😊
For further research, you can pull up the charts of indices like S&P500 or commodities of your choice to see how they moved during each recession. This will help you find some patterns that might assist you in your future investments.

US10Y - Lackluster TradingBased on the weekly timeframe, candlestick closed out as a bearish shooting star, alongside a gap opening @ 4.235 - 4.217% which can be classed as a volume imbalance. The weekly timeframe has left a sour taste in buysides mouth as the upper wick has poached the mean threshold of the 1st -8th Jul monthly timeframe before closing lower.
The two days that we have seen massive impact is Thursday and Friday, with the weekly order block being tagged on the Thursday and the Thursdays daily low taken out on the friday via a candlebody closure below sellside. This indicates further weakness and a possible continuation to the downside, at least to 4.144% weekly sellstops.
With a slight adjustment of the weekly order block, (so, instead if the 4th March 24 OB, 29th Jan 24 OB) i can see that last weeks trading range was 1 tick off from the array @ 4.145%.
With unfinished business at this region, it's safe to say that if the market continues lower, 4.038% will be the end target for next week as a draw on liquidity
