45.09 by first week of junThis channel is not providing individualized trading or investment advice, nor is it a banking service, brokerage service, trading service, investment service or money management service
About Volatility S&P 500 Index
VIX is the trademarked ticker symbol for the CBOE Volatility Index, a popular measure of the implied market volatility of S&P 500 index options. The VIX index has been calculated by the Chicago Board Options Exchange (CBOE) since 1993.
It is often referred to as the fear index or the fear gauge. The VIX projects a range of the expected stock market volatility over the next 30-day period. It is used by traders, institutional investors, and hedge fund managers to diversify portfolios and correlate returns.
It is often referred to as the fear index or the fear gauge. The VIX projects a range of the expected stock market volatility over the next 30-day period. It is used by traders, institutional investors, and hedge fund managers to diversify portfolios and correlate returns.
No news here
Looks like there's nothing to report right now

$VIX target $88-103TVC:VIX looks to be bottoming here and I think the next move higher is going to be the big one I've been waiting for.
We did well last month catching that move into April 7th via UVXY calls. I started buying calls again April 24th for 5/30 - 6/20 and have continued buying as VIX has declined.
N

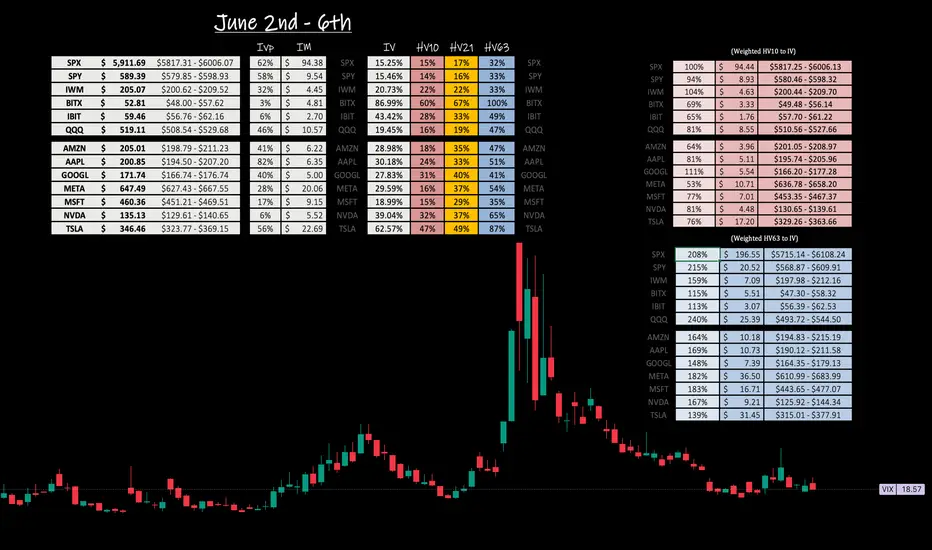
Weekly Volatility Snapshot Volatility, as measured by standard deviation, quantifies market elasticity and provides a level of probability and precision to trade within, that humbles us all.
Last week, the TVC:VIX opened above $21.00 and closed just under $19.00 for a near flat week even for all the eventful action that to
VIX Pump Incoming!The last three big rallies on the NASDAQ were initiated by large volatility spikes on the VIX.
Followed by an average decline of 32%.
Following the NAS tanking 26% from Feb to April 25, Price has already entered into a support zone on the VIX, which has triggered all 3 of the last crashes.
The NA

Still long on this playThis channel is not providing individualized trading or investment advice, nor is it a banking service, brokerage service, trading service, investment service or money management service
On the daily level, we see a 14% risk on the upside, whereas on the downside the risk factor comes in at 3.05% f

Weekly Volatility SnapshotVolatility, as measured by standard deviation, quantifies market elasticity and provides a level of probability and precision to trade within, that humbles us all.
Last week, the TVC:VIX opened steadily dropping as markets rose into Thursday, (June 5th) where the broader markets drilled within t


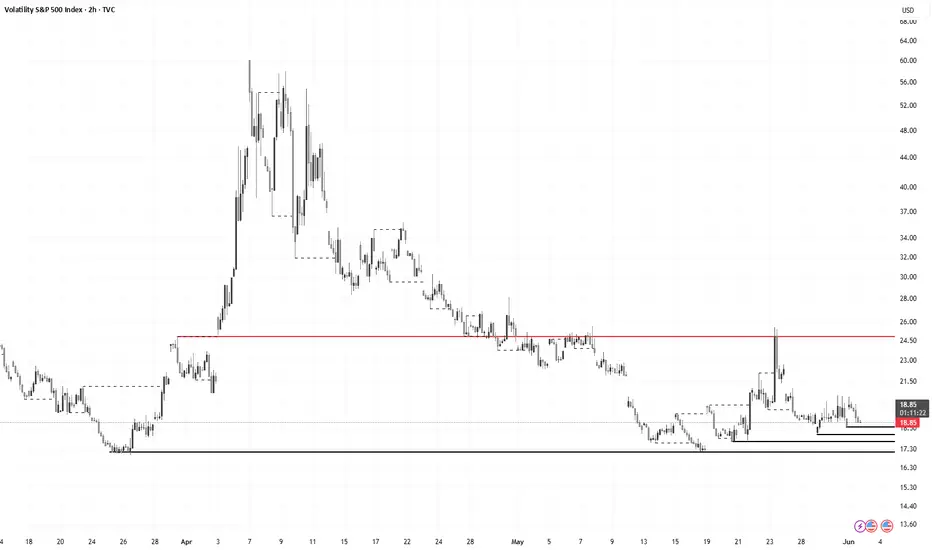
Quiet before the storm: $VIX eerily at low levels. TVC:VIX since the unusual April spike to 60 has been making new lows. It is surprisingly coincidental that the S&P 500 bottomed at 4900 @ which is 0.618 Fib retracement level if we chart the Fib level form the August 2024 spike to the lows of the Nov 2024. Since Feb 2025 highs have come down to 17.

The Calm Before the StormAs of June 2, 2025, the CBOE Volatility Index ( TVC:VIX ) is trading at 18.89, showing a 1.72% increase from the previous close . This uptick suggests that market participants are beginning to price in heightened uncertainty.
Technical Patterns: TVC:VIX has been forming a base around the 18–19 le
See all ideas
Summarizing what the indicators are suggesting.
Oscillators
Neutral
SellBuy
Strong sellStrong buy
Strong sellSellNeutralBuyStrong buy
Oscillators
Neutral
SellBuy
Strong sellStrong buy
Strong sellSellNeutralBuyStrong buy
Summary
Neutral
SellBuy
Strong sellStrong buy
Strong sellSellNeutralBuyStrong buy
Summary
Neutral
SellBuy
Strong sellStrong buy
Strong sellSellNeutralBuyStrong buy
Summary
Neutral
SellBuy
Strong sellStrong buy
Strong sellSellNeutralBuyStrong buy
Moving Averages
Neutral
SellBuy
Strong sellStrong buy
Strong sellSellNeutralBuyStrong buy
Moving Averages
Neutral
SellBuy
Strong sellStrong buy
Strong sellSellNeutralBuyStrong buy
Displays a symbol's price movements over previous years to identify recurring trends.
Frequently Asked Questions
The current value of Volatility S&P 500 Index is 17.22 USD — it has risen by 2.62% in the past 24 hours. Track the index more closely on the Volatility S&P 500 Index chart.
Volatility S&P 500 Index reached its highest quote on Oct 23, 2008 — 96.40 USD. See more data on the Volatility S&P 500 Index chart.
The lowest ever quote of Volatility S&P 500 Index is 8.56 USD. It was reached on Nov 24, 2017. See more data on the Volatility S&P 500 Index chart.
Volatility S&P 500 Index value has decreased by −14.43% in the past week, since last month it has shown a −31.68% decrease, and over the year it's increased by 36.64%. Keep track of all changes on the Volatility S&P 500 Index chart.
Volatility S&P 500 Index is just a number that lets you track performance of the instruments comprising the index, so you can't invest in it directly. But you can buy Volatility S&P 500 Index futures or funds or invest in its components.