UKOILHello traders
Oil is complicated
But there are two scenarios
First The blue lines and
Second Green lines
always in a bearish trend until winter
So, What do you think about it?
Blue or Green? or something else
UKOILSPOT trade ideas

BRENT. Weekly trading levels 3.06.2024 - 7.06.2024During the week you can trade from these price levels. Finding the entry point into a transaction and its support is up to you, depending on your trading style and the development of the situation. Zones show preferred price ranges WHERE to look for an entry point into a trade.
If you expect any medium-term price movements, then most likely they will start from one of the zones.
Levels are valid for a week, the date is in the title. Next week I will adjust the levels based on new data and publish a new post.
! Please note that brokers have a difference in quotes, take this into account when trading.
The history of level development can be seen in my previous posts. They cannot be edited or deleted. Everything is fair. :)
----------------------------------------------
I don’t play guess the direction (that’s why there are no directional arrows), but zones (levels) are used for trading. We wait for the zone to approach, watch the reaction, and enter the trade.
Levels are drawn based on volumes and data from the CME. They are used as areas of interest for trading. Traded as classic support/resistance levels. We see the reaction to the rebound, we trade the rebound. We see a breakout and continue to trade on a rollback to the level. The worst option is if we revolve around the zone in a flat.
Do not reverse the market at every level; if there is a trend movement, consider it as an opportunity to continue the movement. Until the price has drawn a reversal pattern.
Don't forget to like Rocket and Subscribe!!! Feedback is very important to me!

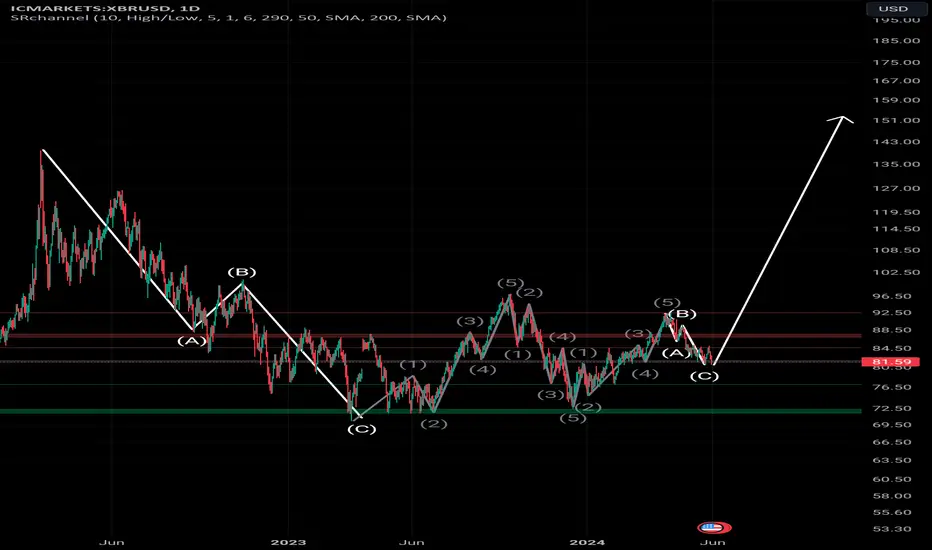
XBRUSD long idea (edited)My 3rd post on this as I counted wrongly earlier :P
Dont worry its still a long. The count was incorrect for my previous post and it did not make any sense lol.
I made a recount and found an extended correction on H4 instead of a 5 wave move down.
So please scratch my previous idea :)

POTENTIAL LONG OPPORTUNITY ON CRUDE OIL (BCOUSD) Hey everyone! Hope you're doing awesome! Just wanted to get on here and do a post on some potential upside I see here on Brent Crude Oil after today's price action!
SO as you can see price has had a hard time breaking past the lows of 81.50-82.00 price handle. Price came down into daily demand and tried breaking lower to downside but now for the 3rd time being rejected to the upside...with buyers buying up this price not allowing it to go lower. This leads me to believe that there could potentially be a upside move for the next move for Crude Oil. Obviously you can see on the 1D (DAILY) timeframe right now the market is overall bearish...but price has now failed to make that new LL showing me potential for an overall pullback on this commodity. ALSO if you look at the 1W (WEEKLY) timeframe you can see that price is actually creating subtle higher lows in price (buyers taking worse prices) which displays to me a demand for this product and a next likely move being to the upside.
On the hourly timeframes now you can see a shift to a bullish market which also gives the bias of the next move on this commodity being to the upside to upside supply around the $87 price point.
Hope this brough some value to you guys! Please boost this post and follow my page for more accurate analysis! Cheers!


A rebound in Crude Oil prices is on the horizon.Since the beginning of the month, there have been signs that crude oil has been falling and this has continued into today's Asian opening at a total of -9.11%. OPEC+ (OPEC with Russia and its allies) wanted to impress the market by extending the mandatory cuts, but the market has turned its attention to the voluntary cuts. The reversal of these cuts has set off a chain of unparalleled bearish movements that have pushed the value of Brent crude from its recent highs of $84.66 to a low of $76.71 a barrel. It is clear that this weekend's meeting was aimed at giving an image of solidity, prolonging, as we said, these cuts and showing a certain unanimity. But Monday's 4% drop on Monday has continued to generate a “Technical Abyss”. Both West Texas and Brent are close to this year's lows.
The market reaction has clearly been depressing for any oil producer, and this will obviously help consumers to rejoice. After such a contrary outcome, it would be foreseeable that they will gradually reverse the voluntary cuts, at least looking ahead to October of this year since they started the cuts in November of last year. If we look at it in aggregate terms, what OPEC+ has done is to start opening the taps and estimates indicate that by 2025 Russia and the United Arab Emirates will be producing 100,000 barrels more than at present, and Saudi Arabia will be producing around 500,000 barrels more.
Surprisingly, inventories have surprised expectations on the upside and there are now downside risks to the $75 to $90 range for Brent according to analysts at Goldman Sachs. The same has occurred in other commodities, which have fallen around 1%, as is the case of copper and iron, and only aluminum and copper saved the session in positive territory. The latter has experienced an intense plunge of 8% since it reached its highs.
If we look at the chart, yesterday's and today's downward movement has closed a price movement that began in February. Now we will have to see if this movement continues, but the RSI is marking 15.02% oversold, which could be marking a possible correction to the $82 area.
Ion Jauregui - ActivTrades Analyst
*******************************************************************************************
The information provided does not constitute investment research. The material has not been prepared in accordance with the legal requirements designed to promote the independence of investment research and such should be considered a marketing communication.
All information has been prepared by ActivTrades ("AT"). The information does not contain a record of AT's prices, or an offer of or solicitation for a transaction in any financial instrument. No representation or warranty is given as to the accuracy or completeness of this information.
Any material provided does not have regard to the specific investment objective and financial situation of any person who may receive it. Past performance is not reliable indicator of future performance. AT provides an execution-only service. Consequently, any person acing on the information provided does so at their own risk.

Brent Crude Oil (XBRUSD): LONG Call, Butterfly Harmonic PatternXABCD Butterfly pattern has been drawn on price chart.
Three White Soldiers appeared signaling an upward break out for the final leg of CD.
Just wait till breakout confirmation once previous LH is breached.
Keeping Stop Loss at previous prominent HL of leg AB, my trading values are mentioned on the chart. Taking 2 trades with 1:1 and 1:2 risk/reward ratio.

Will the downward trend of oil end?📊 Considering that the price is approaching its demand range, if the range of 75.5 units is maintained and the price stabilizes above it, the price may increase to the range of 79.0 units🎯, and if the range is strong, it will reach 81.0 units🎯🎯.
📊 Otherwise, the price may decrease to the range of 73.0 units.

Brent Oil Slides Despite OPEC+ CutsOPEC and allies including Russia, have been implementing a series of supply reductions since late-2022, which have helped support oil prices and on Sunday they agreed to prolong those curbs . Around 3.66 million barrels (mbpd) of cuts that were due to expire at the end of the year were rolled over into 2025. The most recent tranche of 2.2 mbpd that would expire at the end of the month was extended into Q3 and will be phased of gradually after that. The decision keeps current total reduction cuts at nearly 5.9 mbpd and almost 6% of global output.
On the other hand, members will start tapering some of those curbs over a 12-month period starting in the fourth quarter and the detailed plan could hinder their ability to keep output lower, if such need arises. Furthermore, the group sidestepped the contentious issue of capacity, while compliance has generally been loose in the past.
Brent oil slumps following the decision, as output will start to go up from October, just as non-OPEC countries like the US keep pumping oil. At the same time, demand growth is expected to decelerate sharply this year. Optimism for Middle East ceasefire, along with poor China PMIs, also contributed. UKOil is now exposed to this year’s lows (74.76), although breaching those of 2023 (70.09) is a much harder task.
However, the deep output cuts by OPEC+ will lead to tighter market at least in the near term and this can continue to support oil prices. Furthermore, central banks are moving towards less restrictive monetary policies, which can also help. On the technical side, the RSI points to extremely oversold conditions that can contain the fall and give UKOil the opportunity to rebound. A return above the EMA200 (blackline) that would pause the bearish bias would need strong catalyst though and the upside is unfriendly.
Stratos Markets Limited (www.fxcm.com):
CFDs are complex instruments and come with a high risk of losing money rapidly due to leverage. 68% of retail investor accounts lose money when trading CFDs with this provider . You should consider whether you understand how CFDs work and whether you can afford to take the high risk of losing your money.
Stratos Europe Ltd (trading as “FXCM” or “FXCM EU”), previously FXCM EU Ltd (www.fxcm.com):
CFDs are complex instruments and come with a high risk of losing money rapidly due to leverage. 73% of retail investor accounts lose money when trading CFDs with this provider . You should consider whether you understand how CFDs work and whether you can afford to take the high risk of losing your money.
Stratos Trading Pty. Limited (www.fxcm.com):
Trading FX/CFDs carries significant risks. FXCM AU (AFSL 309763). Please read the Financial Services Guide, Product Disclosure Statement, Target Market Determination and Terms of Business at www.fxcm.com
Stratos Global LLC (www.fxcm.com):
Losses can exceed deposits.
Any opinions, news, research, analyses, prices, other information, or links to third-party sites contained on this video are provided on an "as-is" basis, as general market commentary and do not constitute investment advice. The market commentary has not been prepared in accordance with legal requirements designed to promote the independence of investment research, and it is therefore not subject to any prohibition on dealing ahead of dissemination. Although this commentary is not produced by an independent source, FXCM takes all sufficient steps to eliminate or prevent any conflicts of interests arising out of the production and dissemination of this communication. The employees of FXCM commit to acting in the clients' best interests and represent their views without misleading, deceiving, or otherwise impairing the clients' ability to make informed investment decisions. For more information about the FXCM's internal organizational and administrative arrangements for the prevention of conflicts, please refer to the Firms' Managing Conflicts Policy. Please ensure that you read and understand our Full Disclaimer and Liability provision concerning the foregoing Information, which can be accessed via FXCM`s website:
Stratos Markets Limited clients please see: www.fxcm.com
Stratos Europe Ltd clients please see: www.fxcm.com
Stratos Trading Pty. Limited clients please see: www.fxcm.com
Stratos Global LLC clients please see: www.fxcm.com
Past Performance is not an indicator of future results.

XBR USD SWING LONG ENTRYCrude oil has completed a 3 wave correction on the daily and also corrected on the h4. And will be seeing a higher highs from here breaking the resistance. It's important to note that this trade is high rr with small risk. I will be taking this trade few hours market open.
Let me know if you have any questions agree disagree I will be listening :)
Trade safe!
Oil Long Term View: Start of uptrend in Q4 2024, $125+ in 2025Short term potentially in a cup and handle pattern since June 2022, currently in the distribution stage around the bottom. Needs to close above 21M EMA for confirmation. An uptrend can start in Q4 2024, which would get the price to $125+ in 2025. Long term the price seems to be in an uptrend since 2016, if excluding the 2020 outlier. The resistance at 200M EMA seems to have changed into support. Momentum is beginning to increase to the upside, as liquidity and M2 money supply will increase beginning in Q3-Q4 2024.

CRUDE-RETRACEMENTDaily: Formation of 1-2 RTM, and previous daily high currently showing strength for breakabove
Entry expected to be below 8hr Previous low

Brent Finds Support at 76.764 Amid Pivot Point WatchHello Everyone,
Brent has experienced a steady decline to 76.764, where it has since found support. Currently, the price is moving towards the 1Y/1M pivot point. It remains to be seen whether these pivot points will act as support or resistance in the future. For now, however, a solid support level appears to have been established.
TradeWithTheTrend3344

XBR, is starting to BURN "UP"! MASSIVE ascend coming!XBR accumulators is close to winning the battle. The last few days of continued net buying has pushed the price significantly higher with so much gusto and strength.
Price surged a weighty 2.2% last trading day.
On weekly histogram, higher lows has been recorded conveying of a long term trend shift. Pricewise, XBR is moving thinly at the current range -- closer to breaking out the descending trendline. It is now sitting at 5.0 FIB level - a major order block support where most buyers converge.
Based on the recent price action and volume surge expect some significant price growth from the present price range.
Spotted at 78.00
TAYOR
Safeguard capital always.

Oil May Correct UpOil prices dropped more than $1 on Tuesday due to skepticism over an OPEC+ decision to increase supply later this year, amidst already weak global demand. Extending losses from the previous session, Brent crude futures fell $1.11, or 1.4%, to $77.25 a barrel, hitting a low of $76.76. U.S. West Texas Intermediate (WTI) crude futures declined by $1.09, or 1.5%, to $73.13.
OPEC+ agreed on Sunday to extend most oil output cuts into 2025 but allowed for gradual unwinding of voluntary cuts from October. This raised concerns about oversupply, especially with high interest rates and weak economic signals from the U.S., China, and Europe affecting oil demand.
Non-OPEC producers, particularly the U.S., are also increasing supply. Market strategist Yeap Jun Rong noted that further evidence of economic weakness could push oil prices even lower. The U.S. government is set to release inventory and demand data on Wednesday, which will indicate gasoline consumption during the Memorial Day weekend, marking the start of the U.S. driving season.

BRENT OIL SELL , A GOOD WAVE LONG TERM SELL SET UP Wave inside another wave. a correction after the retest impulse is a great entry for a long term sell

UKOILHello Traders
My idea about OIL is Bullish
To the targets
After breaking the 82 $ and retesting the price the goals on the chart
Good luck

Will oil return to its bullish market?📊 According to the buying pressure in the market and the breaking of the downward movement of the price upwards, if the range of 84.5 units is broken upwards and the price stabilizes above it, the price may increase to the range of 87.0 🎯 and in the case of the strength of the range of 88.6 units🎯🎯.
📊 Otherwise, the price may decrease to the range of 81.5 units.

BRENT. Weekly trading levels 27 - 31.05.2024During the week you can trade from these price levels. Finding the entry point into a transaction and its support is up to you, depending on your trading style and the development of the situation. Zones show preferred price ranges WHERE to look for an entry point into a trade.
If you expect any medium-term price movements, then most likely they will start from one of the zones.
Levels are valid for a week, the date is in the title. Next week I will adjust the levels based on new data and publish a new post.
! Please note that brokers have a difference in quotes, take this into account when trading.
The history of level development can be seen in my previous posts. They cannot be edited or deleted. Everything is fair. :)
----------------------------------------------
I don’t play guess the direction (that’s why there are no directional arrows), but zones (levels) are used for trading. We wait for the zone to approach, watch the reaction, and enter the trade.
Levels are drawn based on volumes and data from the CME. They are used as areas of interest for trading. Traded as classic support/resistance levels. We see the reaction to the rebound, we trade the rebound. We see a breakout and continue to trade on a rollback to the level. The worst option is if we revolve around the zone in a flat.
Do not reverse the market at every level; if there is a trend movement, consider it as an opportunity to continue the movement. Until the price has drawn a reversal pattern.
Don't forget to like Rocket and Subscribe!!! Feedback is very important to me!

BRENT. Weekly trading levels 10.06.2024 - 14.06.2024During the week you can trade from these price levels. Finding the entry point into a transaction and its support is up to you, depending on your trading style and the development of the situation. Zones show preferred price ranges WHERE to look for an entry point into a trade.
If you expect any medium-term price movements, then most likely they will start from one of the zones.
Levels are valid for a week, the date is in the title. Next week I will adjust the levels based on new data and publish a new post.
! Please note that brokers have a difference in quotes, take this into account when trading.
The history of level development can be seen in my previous posts. They cannot be edited or deleted. Everything is fair. :)
----------------------------------------------
I don’t play guess the direction (that’s why there are no directional arrows), but zones (levels) are used for trading. We wait for the zone to approach, watch the reaction, and enter the trade.
Levels are drawn based on volumes and data from the CME. They are used as areas of interest for trading. Traded as classic support/resistance levels. We see the reaction to the rebound, we trade the rebound. We see a breakout and continue to trade on a rollback to the level. The worst option is if we revolve around the zone in a flat.
Do not reverse the market at every level; if there is a trend movement, consider it as an opportunity to continue the movement. Until the price has drawn a reversal pattern.
Don't forget to like Rocket and Subscribe!!! Feedback is very important to me!

$BRENT OilBLACKBULL:BRENT
The proposed (Y) wave in oil already looks very well-proportioned in terms of size and time.
There is a slight alternative scenario where prices could exceed $125, but more on that another time. Most likely, it will form a triangle.
Update:

"Crude Awakening: Analyzing the possible Surge in Oil Prices""Oil: No place to go but up"
A chart off oil for the last 50 years has never further deviated from its standard deviation compared over the cost of a risk-free asset such as the "US10Y".
This chart has only once ever reached its 2nd standard deviation once in the last 50 years.
Let first take a look at the first scenario to get a brief understanding of what this would mean for oil. Not to be ignored but equities, economics and politics combined.
Going back to an iconic year, the beginning of 1999. Nearing the end of the most significant bull run in equities history lasting 2 decades. Would see the S&P go up 10-fold from $100 to over $1000usd. To understand what would lead oil to deviate so far below its mean we would need to understand what lead the S&P to perform so well.
Of course, this would be situation of what some would say "the stars to align" and what would later be referred to as the "Goldy Locks Zone". At the for front was low geopolitical conflict, no major wars and economic stability would of course prime the events in which would occur.
Pulling the hood back and looking at what would be driving this surge in growth in the economy and equities would be a lagging effect of the USD no longer being backed by gold and this being matched with the lowering of interest rates. This 20-year period of low interest rates, lowering unemployment and lowering inflation would lead to a primed economy for growth in equities which in fact would negatively impact the price of such commodities as GOLD and Oil. This would see oil reach (unbeknownst to the people of its time) its 2nd standard deviation withing a 50-year period when oils compared to a risk-free asset "government bonds". It was soon to be know after as what was the beginning of some would refer to as a "Lost Decade".
In which 10 years later to the day if you had bought the S&P 500 SP:SPX you would still be down a whole 45%. The Dow Jones Industrial average TVC:DJI was down 35%. Other well known and sort after companies such as Amazon NASDAQ:AMZN had lost up to 93% and were still to be down 53% at bottom of the GFC all that 10 years later.
TVC:GOLD
It was not be all bad news, as some markets did perform dramatically and make a recovery. Gold would once again become highly sort after. At the start of the lost decade gold had been in a bear market for over 20 years. Since it was last sitting at all-time highs of $860 USD/OZ Gold lost a incredible 67% of its value and was sitting around $280 USD/OZ all that 20 years later. In the years to come people of its time would see gold have one of its most memorable bull runs. Throughout the next 10 years gold would break past its previous all-time high push up and past $1000 USD/OZ a 250% return only to be short lived. Being drawn down with the rest of markets and by the end of the 10-year period gold still stood at $715 USD/OZ and still up 150%.
TVC:UKOIL
Oil would also make history in its dramatic bull run starting at $10USD per barrel after two decades of price decline would later go on to form a huge bubble in oil and its price to top out at incredible $150 USD a Barrel and insane 1,500% only for its bubble to burst due to the GFC and return its pricing back to reality off less than 1/3rd of its previous pricing and found the bottom of the crash at less than $50 USD per Barrel. Still to be up 300% and far outperforming equities.
The second thing to understand about this comparison is to understand is the US10Y and its relationship to interest rates, inflation and the unemployment rate.
As you can see there is a high degree of correlation within these three metrics. US10y interest rates and inflation. The correlation these have with Unemployment is usually the inverse relationship. As unemployment goes up these tend to come down with interest rates being lowered as a measure to try stimulate the economy.
The inverse relationship
With unemployment looking to tick up it is expected that interest rates will not proceed higher therefore the US10Y to come down when the government decide unemployment is getting too big a tail wind.
The previous time the comparison was at its standard two deviation the unemployment rate had almost two years before unemployment rising would become a problem. So the government tried to cut rates possibly a little too early which lead to oil beginning to surge and being a main driver in inflation, inflation once again began to rise which again caused the government to raise rates again only to set of unemployment and rates to come down which in this case brought inflation down with it and what was to be the burst of the tech bubble that sent the economy spiralling back to reality.
However, in this scenario with unemployment rising already then, the possibility for unemployment rates to go out of control then raising rates therefore causing the US10Y to go higher seems to be out of the question. The only way $UKOIL/US10Y could possibly go lower is if the price of oil proceeds lowers or if the price of oil remains and the US10Y goes higher.
Which is not to say it is possible for this comparison to reach its 3rd or fourth standard deviation it just becomes more and more of an anomaly and is generally short lived met with high volatility.
This box highlights a more alike scenario of unemployment rising, inflation being tamed a little, rates hikes being kept stable and the UKOIL/US10Y comparison finding on its average.
Another observation is off oil being on its long-term support trendline. Also Finding support on top of its Along-term average.
Another chart that could also be a protagonist for an increase in oil or vice versa oil being a protagonist for increase in Energy is a false breakout only to be currently trading back up on top of it 50% retracement from its current highs is the S&P energy sector.
Obviously, nothing is of certain and to react and not to predict. So, a bounce or rejection of these levels is something that may want to be watched.
