UNIUSDT.3S trade ideas

UNI done correcting or ready for another leg down?UNI dumped 39% after the bearish Supertrend Ninja - Clean signal on the 3th April (red vertical line on the background). The Supertrend Ninja - Clean gave 2 bullish signals in 2020 (with the biggest 1065%). In 2021 it gave 2 bullish signals, with 1 bullrun (33%). In 2022 it gave 1 bullish signal, with no follow up.
Whereas UNI corrected at least 22% - 66% after each bearish Supertrend Ninja signal (based on the last 4 signals).
Let's have a look at the other indicators. The Stoch RSI is in oversold levels, pointing downwards. K is below D, which is a bearish sign.
UNI is still in the Bearish Zone of the Ichimoku Cloud , which is bearish .
The RSI is almost in oversold area at 34 (40-60).
If we take a look at the Average Directional Index ( ADX DI) its bearish . The +DI (Green Line) is below the -DI (Red Line). While the Trend Strength is becoming stronger. Since the ADX (Orange Line) is above its 9 Period EMA (Black Line).
Currently UNI is also below its Bollinger Bands Middle, Band Basis 20 Period SMA and the Least Squares Moving Average ( LSMA ). Which are bearish signs. Going down here, the next support is at 5.85 USDT. Supports and Resistances are highlighted as grey blocks.
Conclusion: UNI moving sideways or going downwards. I'll wait patiently on a bullish Supertrend Ninja signal, before entering a long.
Thank you for reading.
Namasté 🙏
Disclaimer: Ideas are for entertainment purposes only. Not financial advice. Your own due diligence is highly advised before entering trades. Past performance is no guarantee of future returns.
What Indicators Do I Use:
In the chart I am using the "Supertrend Ninja - Clean", which is a trend-following indicator (Green and red vertical lines on the background). When the background of the candlestick closes green (vertical line). It indicates a possible bullish (up)trend. And red for downtrends.


Uni sawp /usdtHello
UNI swap chart in 3-hour timeframe
...
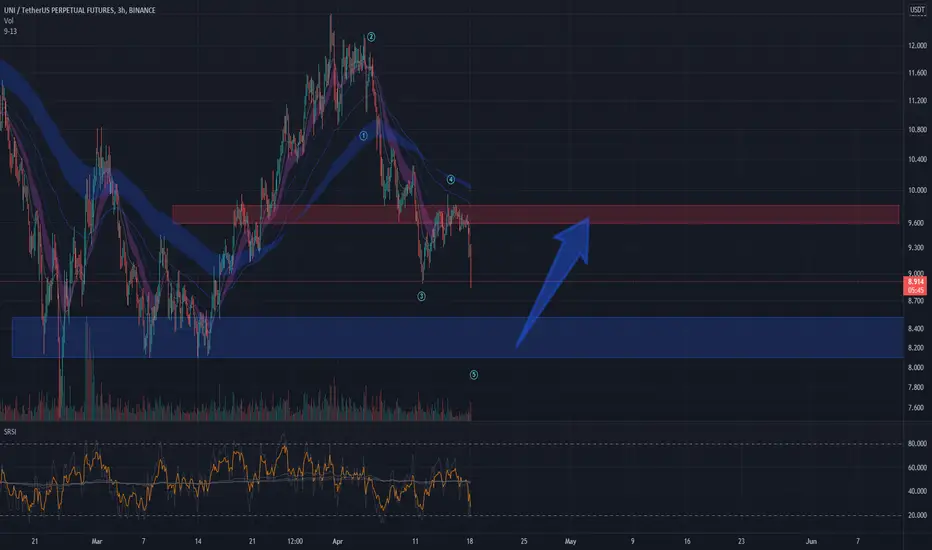
Pay attention to the support range
In addition, there is a possibility of breaking the downtrend in rsi and price
what is your opinion ?


UNI - The unicorn is dying☠️☠️☠️- BTC is bearish
- Trend is bearish
- Level is clearly visible
- 3rd touch
- Level is 50 days old and historical
- Under VWAP
- Will enter when price squeezes to the level on lower timeframes, the base will form and the strip will get faster.
What do you think of this idea? What is your opinion? Share it in the comments📄🖌
If you like the idea, please give it a like. This is the best "Thank you!" for the author 😊
P.S. Always do your own analysis before a trade. Put a stop loss. Fix profit in parts. Withdraw profits in fiat and reward yourself and your loved ones

UNIUSDTHello Crypto Lovers,
Mars Signals team wishes you high profits.
This is a one-day-time frame analysis for UNIUSDT
There was a weakness in price after touching the first resistance line. Then it had a fall. Now it is expected to move to the resistance line when in reaches the support line. Mind the stop-loss please.
Warning: This is just a suggestion and we do not guarantee profits. We advise you to analyze the chart before opening any positions.
Wish you luck

to the targethere we are again
the market now gives a chance to make some profits
please make sure you do SL
Happy flying

Uniswap (UNI) - April 27hello?
Traders, welcome.
By "following", you can always get new information quickly.
Please also click "Like".
Have a nice day.
-------------------------------------
(UNIUSDT 1W Chart)
It must move above 11.42 to turn into an uptrend.
It needs to rise above 15.0 to continue the uptrend.
If it does not fall below the downtrend line, it is expected to rise.
------------------------------------------------------------ -----------------------------------------------------
** All indicators are lagging indicators.
Therefore, it is important to be aware that the indicator will move accordingly as price and volume move.
However, for the sake of convenience, we are talking in reverse for the interpretation of the indicator.
** The MRHAB-T indicator used in the chart is an indicator of our channel that has not been released yet.
** The OBV indicator was re-created by applying a formula to the DepthHouse Trading indicator, an indicator disclosed by oh92. (Thanks for this.)
** Support or resistance is based on the closing price of the 1D chart.
** All descriptions are for reference only and do not guarantee a profit or loss in investment.
(Short-term Stop Loss can be said to be a point where profit and loss can be preserved or additional entry can be made through split trading. It is a short-term investment perspective.)
---------------------------------

UNUSDT BUTTERFLYButterfly
The Butterfly Pattern is a distinct 5-point extension structure that was discovered by Bryce Gilmore and further defined by Scott Carney. It has specific Fibonacci measurements for each point within its structure and it is important to note that D is not a point, but rather a zone in which price is likely to reverse, called the Potential Reversal Zone (PRZ). The B point retracement of the primary XA leg lies at 0.786 and the PRZ consists of 3 converging harmonic levels: 1) 1.27 extension of the primary XA leg, 2) AB=CD pattern, either equivalent or 1.27 and 3) Extreme BC projection of 2.00, 2.24 or 2.618.
The first target would be the 382 retracement of AD and the second target the 618 retracement of AD. Common stop levels lie behind the next structure level after the D point or the 1.41 extension of XA. Conservative traders look for additional confirmation. These patterns can be bearish and bullish . TradingView has a smart XABCD Pattern drawing tool to visually identify 5-point reversal structures.


UNIUSD - At this point we can expect a nice bounce. But the poiAt this point we can expect a nice bounce.
But the point to remember is that the downtrend may not be over yet.
Simple RSI Setup (DEFI Summer)Are we going to have a DEFI summer? RSI is floored and foreshadows a breakout of red line resistance zone.

Long $UNI - 15$ TargetUNI has been in a long phase of consolidation with strong support between 8$ and 9$. With a trend reversal imminent we can long UNI from current price ~$9 up to $15 easily.

Short on UNI$UNI broke through the ascending trendline. Decline to support level at 7,69$ is expected to happen.

UNI resistance breakoutprobably buying if this 4h candle (which is also the last 1D) closes above the 4h resistance rectangle I drew
TP1: 10.8
TP2: 11.2
SL: 8.85
leave a like if this was helpful!
let me know what you think in the comments ↓

Uniswap shortUniswap bounced off the resistance level. Asset bounced down off the bearish trendline. Decline to support level at 8.9 is expected to happen.

$UNI UPUNI might just take a BULLISH TURN. Although, reconfirmation may be required but i see Bull movement for the week.
It just my thoughts


Uniswap Uniswap is a popular decentralized trading protocol, known for its role in facilitating automated trading of decentralized finance (DeFi) tokens.
An example of an automated market maker (AMM), Uniswap launched in November 2018, but has gained considerable popularity this year thanks to the DeFi phenomenon and associated surge in token trading.
Uniswap aims to keep token trading automated and completely open to anyone who holds tokens, while improving the efficiency of trading versus that on traditional exchanges.
Uniswap creates more efficiency by solving liquidity issues with automated solutions, avoiding the problems which plagued the first decentralized exchanges.
In September 2020, Uniswap went a step further by creating and awarding its own governance token, UNI, to past users of the protocol. This added both profitability potential and the ability for users to shape its future — an attractive aspect of decentralized entities.

Open Short Position on UNIUSDT!In 4H Time Frame, The Up-Trend is end and You can see 3 points of confirmation to changed the Trend! I saw it late so I lost the good position with Low SL. My SL for this position is about 5.5% and its little high!

UNISWAP - Reversal Patterns 👀Uniswap has recently broken out of a descending wedge, which is a common reversal pattern. After breaking out, we appear to be coming back to the lows - possibly double bottom, which is another reversal pattern. Both the descending wedge and double bottom patterns are indicating that we may get a bullish reversal very soon!
Trade Idea:
- Watch for price action around the double bottom region
- Once bullish PA appears, enter with stops below the lows
- Targets: 28, 44, actively manage the rest
Goodluck and as always, trade safe!
