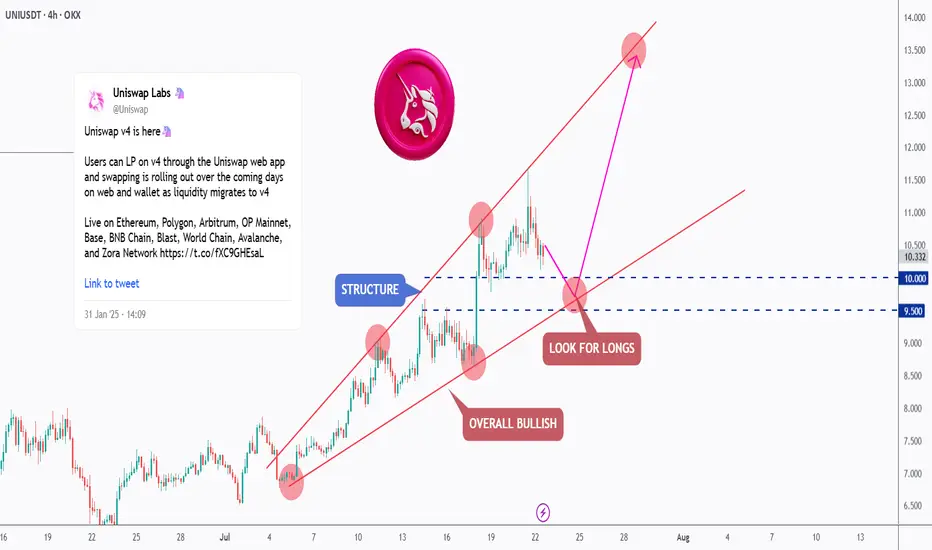
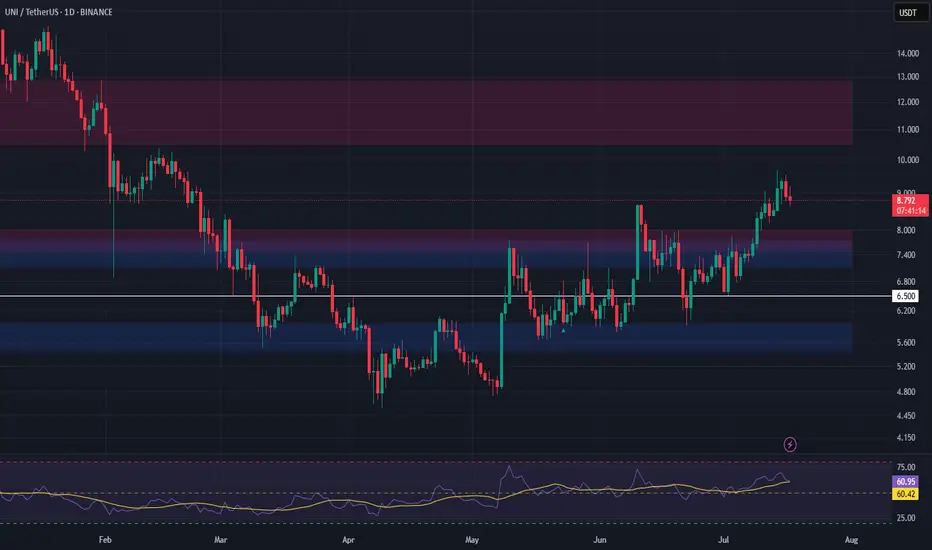
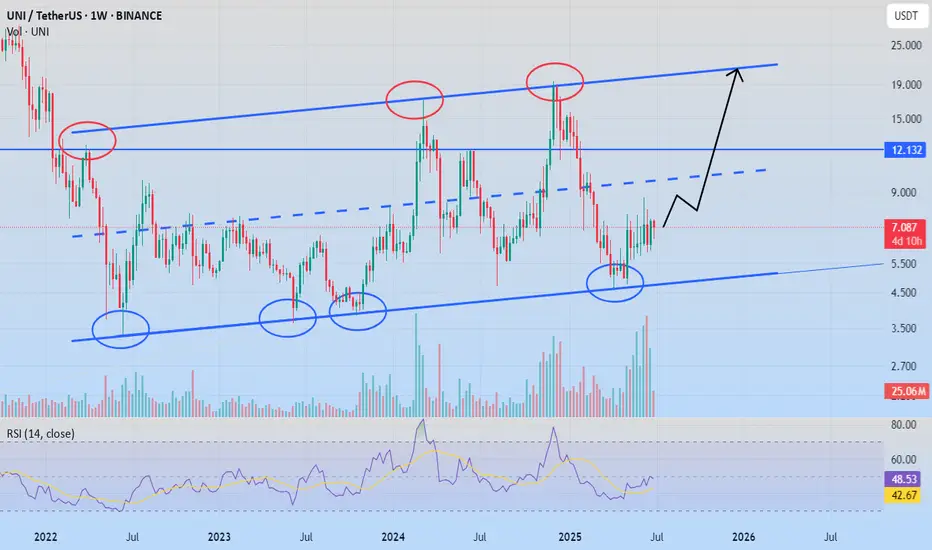
[Deep Dive] UNI – Edition 1: Retest. Reload. Rally?Uniswap (UNI) has been trading within a well-respected rising channel, showing consistent bullish structure across the 4H timeframe.
After a strong rally from the $7.50 region, price is now undergoing a healthy correction — retesting the lower boundary of the channel, which intersects with the $9.50–$10.00 demand zone.
📐 Technical Outlook
The market has printed a series of higher highs and higher lows, confirming the bullish momentum. The recent correction is testing a key support structure — previously a resistance zone — and this confluence aligns perfectly with the channel’s lower bound.
As long as this zone holds, UNI is well-positioned for a continuation toward the $13–$14 region, in line with the pink projected path.
🔥 Fundamental Boost
Uniswap has recently launched its V4 upgrade, introducing "hooks" — customizable smart contracts that allow developers to build more complex DeFi logic directly within liquidity pools. This upgrade not only enhances flexibility and capital efficiency, but also reduces gas costs — making Uniswap an even more dominant player in the DEX ecosystem.
Additionally, with Ethereum L2 adoption growing and Uniswap expanding across multiple chains (Arbitrum, Base, and Optimism), protocol usage and fees are on the rise again.
The UNI token may soon benefit from the proposed fee switch, which would redirect a portion of protocol fees to token holders — potentially adding new value accrual mechanics.
🟢 Conclusion
The technicals and fundamentals are aligning. UNI is in a bullish structure, trading at a key area of interest, and the latest upgrades may unlock new growth for the ecosystem.
Traders and investors alike should keep a close eye on this zone for long opportunities, as the next impulse could be just around the corner.
💬 What do you think — is UNI ready to break toward new highs, or will the demand zone fail? Let me know in the comments 👇
🔔 Disclaimer: This analysis is for educational and informational purposes only. It does not constitute financial advice or a recommendation to buy or sell any asset. Always do your own research and manage your risk accordingly.
📚 Always follow your trading plan => including entry, risk management, and trade execution.
Good luck!
All strategies are good, if managed properly.
~ Richard Nasr
UNIUST trade ideas
UNI/USDT – Technical Analysis (3D)Confirmed Structural Breakout – Swing Targets + Fibonacci Extensions - With alignment across technical structure, product roadmap, on-chain adoption and regulatory tailwinds, UNI has a clear path to re-test its ATH around $45—assuming the market stays bullish and upcoming catalysts deliver.
🔍 The asset UNI/USDT has just broken out of a multi-month range between 4.80 and 10.60 USDT, confirming a Change of Character (CHoCH) on the 3-day timeframe.
🧠 Technical Context
⏱ Timeframe: 3D (mid/long term)
⚙️ Market Structure: Confirmed trend reversal after multiple CHoCH and BoS since 2023
🔁 Long consolidation > recent breakout with bullish volume and RSI > 70 (strong momentum)
🎯 Breakout above the key resistance at 10.66 USDT now validated
📏 Target Levels (Take Profits)
TP1: 10.66 USDT (confirmed breakout / potential retest)
TP2: 13.00 USDT (horizontal resistance)
TP3: 15.00 USDT
TP4: 20.00 USDT
TP5: 29.58 USDT
TP6: 45.85 USDT (maximum Fib extension)
⚡ TP3 to TP5 were calculated using Fibonacci extensions (1.618, 2.0, and 2.618) from the latest impulsive move.
📐 Risk-Reward Ratio (RR)
TP1 : 0.94
TP2 : 1.80
TP3 : 3.95
TP4 : 8.06
TP5 : 15.04
(calculés sur base d’entrée 10.80 / SL 8.47)
⏳ Estimated Timeframe
4 to 12 weeks, depending on market volatility.
🧩 Indicators
RSI 14: 71.23 → in bullish territory, no bearish divergence detected
Structure: multiple CHoCH and Breaks of Structure (BoS) confirmed
No bearish divergence on recent local tops
📌 Current Scenario
📈 Bullish as long as price holds above 9.32 USDT (swing low / key support)
A pullback to the 9.95–10.20 USDT zone would offer a solid entry with good RR
⚠️ To Watch
Retest near 10.00 USDT for a healthy consolidation
Possible resistance around 13–15 USDT (previous congestion zone)
Daily close above 10.66 to unlock higher Fibonacci targets
💡 Conclusion
UNI is showing a mid-term trend reversal, confirmed by structural breaks and solid momentum. Targets at 15, 20, and 29 USDT are realistic in the coming weeks to months.
This is not financial advice. Always do your own research and assess risks yourself.

UNI Market Cap Breakout Signals Major Repricing Ahead 🚀📈 UNI Market Cap Breakout Signals Major Repricing Ahead 💥💹
Forget the December highs. That spike? It came with a bloated market cap and little real growth. T oday, it’s different.
UNI has reclaimed the key $10 level, but more importantly, its market cap structure is breaking out after years of compression — and that’s where the real alpha lives.
🔍 Technical View (Market Cap-Driven)
🔹 UNI broke above the $10.94 price zone with strong momentum
🔹 Currently retesting the $9.73 breakout base — a critical zone for bullish continuation
🔹 Market cap structure targets:
– Next milestone: $14.72 (aligned with local resistance)
– Macro extension target: $17.70, corresponding to a market cap near $18.08B
This puts UNI at the doorstep of a major repricing phase.
🧠 Why This Time Is Different
✅ Market Cap Breakout – We’re not just looking at price anymore. The structure on the market cap chart shows accumulation and a clean breakout from multi-year compression.
✅ Whale Activity – Addresses holding 1M+ UNI are growing fast. Over $60M in UNI was moved off exchanges in July alone.
✅ Protocol Expansion
– Uniswap v4 is imminent, introducing Hooks, dynamic fees & native ETH support
– Unichain L2 has now hit 6.3M wallets and 147M txs, growing faster than expected
✅ DeFi Rotation – Capital is rotating back into blue-chip DeFi. Uniswap isn’t just riding that wave — it’s helping define it.
🏁 What We’re Watching
🟦 Support: $9.73 – this must hold for continuation
🟩 Target 1: $14.72
🟩 Target 2: $17.70 (aligned with $18.08B mcap)
🟨 Risk zone below: $9.03 – invalidation if daily closes below
This is not about retesting old prices. It’s about rewriting the valuation story.
The UNI bulls aren't just hunting a T-bone — they’re after a full 8-figure steak. 🥩🧠
One Love,
The FXPROFESSOR 💙
D isclosure: I am happy to be part of the Trade Nation's Influencer program and receive a monthly fee for using their TradingView charts in my analysis. Awesome broker, where the trader really comes first! 🌟🤝📈


UNIUSDT UPDATE
Pattern: Falling Wedge Breakout
Current Price: \$10.545
Target Price: \$16
Target % Gain: 52%
Technical Analysis: UNI has broken out of a long-term falling wedge on the 1D chart with a strong bullish candle and 18% daily gain. Volume spike confirms breakout momentum with upside potential toward \$16.
Time Frame: 1D
Risk Management Tip: Always use proper risk management.

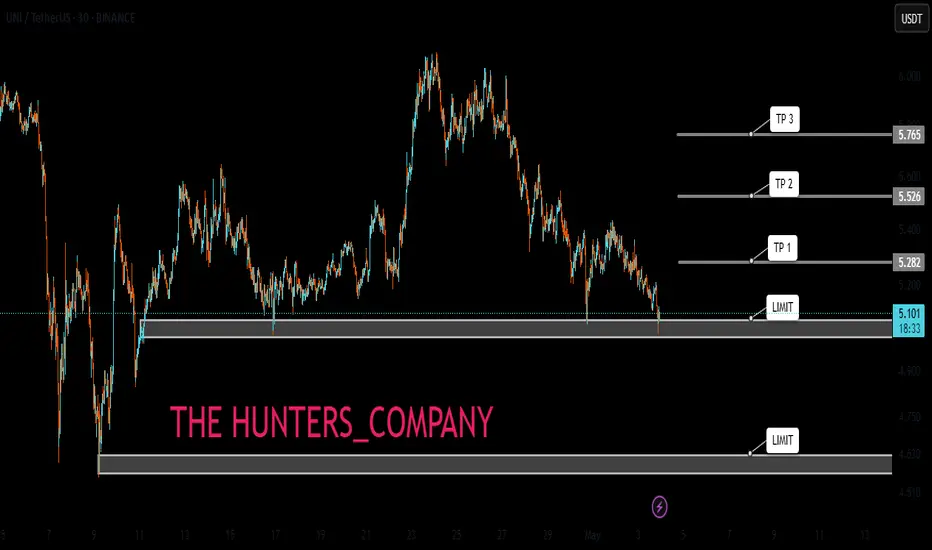
UNI/USDTKey Level Zone: 7.620 - 7.680
LMT v2.0 detected.
The setup looks promising—price previously trended upward with rising volume and momentum, then retested this zone cleanly. This presents an excellent reward-to-risk opportunity if momentum continues to align.
Introducing LMT (Levels & Momentum Trading)
- Over the past 3 years, I’ve refined my approach to focus more sharply on the single most important element in any trade: the KEY LEVEL.
- While HMT (High Momentum Trading) served me well—combining trend, momentum, volume, and structure across multiple timeframes—I realized that consistently identifying and respecting these critical price zones is what truly separates good trades from great ones.
- That insight led to the evolution of HMT into LMT – Levels & Momentum Trading.
Why the Change? (From HMT to LMT)
Switching from High Momentum Trading (HMT) to Levels & Momentum Trading (LMT) improves precision, risk control, and confidence by:
- Clearer Entries & Stops: Defined key levels make it easier to plan entries, stop-losses, and position sizing—no more guesswork.
- Better Signal Quality: Momentum is now always checked against a support or resistance zone—if it aligns, it's a stronger setup.
- Improved Reward-to-Risk: All trades are anchored to key levels, making it easier to calculate and manage risk effectively.
- Stronger Confidence: With clear invalidation points beyond key levels, it's easier to trust the plan and stay disciplined—even in tough markets.
Whenever I share a signal, it’s because:
- A high‐probability key level has been identified on a higher timeframe.
- Lower‐timeframe momentum, market structure and volume suggest continuation or reversal is imminent.
- The reward‐to‐risk (based on that key level) meets my criteria for a disciplined entry.
***Please note that conducting a comprehensive analysis on a single timeframe chart can be quite challenging and sometimes confusing. I appreciate your understanding of the effort involved.
Important Note: The Role of Key Levels
- Holding a key level zone: If price respects the key level zone, momentum often carries the trend in the expected direction. That’s when we look to enter, with stop-loss placed just beyond the zone with some buffer.
- Breaking a key level zone: A definitive break signals a potential stop‐out for trend traders. For reversal traders, it’s a cue to consider switching direction—price often retests broken zones as new support or resistance.
My Trading Rules (Unchanged)
Risk Management
- Maximum risk per trade: 2.5%
- Leverage: 5x
Exit Strategy / Profit Taking
- Sell at least 70% on the 3rd wave up (LTF Wave 5).
- Typically sell 50% during a high‐volume spike.
- Move stop‐loss to breakeven once the trade achieves a 1.5:1 R:R.
- Exit at breakeven if momentum fades or divergence appears.
The market is highly dynamic and constantly changing. LMT signals and target profit (TP) levels are based on the current price and movement, but market conditions can shift instantly, so it is crucial to remain adaptable and follow the market's movement.
If you find this signal/analysis meaningful, kindly like and share it.
Thank you for your support~
Sharing this with love!
From HMT to LMT: A Brief Version History
HM Signal :
Date: 17/08/2023
- Early concept identifying high momentum pullbacks within strong uptrends
- Triggered after a prior wave up with rising volume and momentum
- Focused on healthy retracements into support for optimal reward-to-risk setups
HMT v1.0:
Date: 18/10/2024
- Initial release of the High Momentum Trading framework
- Combined multi-timeframe trend, volume, and momentum analysis.
- Focused on identifying strong trending moves high momentum
HMT v2.0:
Date: 17/12/2024
- Major update to the Momentum indicator
- Reduced false signals from inaccurate momentum detection
- New screener with improved accuracy and fewer signals
HMT v3.0:
Date: 23/12/2024
- Added liquidity factor to enhance trend continuation
- Improved potential for momentum-based plays
- Increased winning probability by reducing entries during peaks
HMT v3.1:
Date: 31/12/2024
- Enhanced entry confirmation for improved reward-to-risk ratios
HMT v4.0:
Date: 05/01/2025
- Incorporated buying and selling pressure in lower timeframes to enhance the probability of trending moves while optimizing entry timing and scaling
HMT v4.1:
Date: 06/01/2025
- Enhanced take-profit (TP) target by incorporating market structure analysis
HMT v5 :
Date: 23/01/2025
- Refined wave analysis for trending conditions
- Incorporated lower timeframe (LTF) momentum to strengthen trend reliability
- Re-aligned and re-balanced entry conditions for improved accuracy
HMT v6 :
Date : 15/02/2025
- Integrated strong accumulation activity into in-depth wave analysis
HMT v7 :
Date : 20/03/2025
- Refined wave analysis along with accumulation and market sentiment
HMT v8 :
Date : 16/04/2025
- Fully restructured strategy logic
HMT v8.1 :
Date : 18/04/2025
- Refined Take Profit (TP) logic to be more conservative for improved win consistency
LMT v1.0 :
Date : 06/06/2025
- Rebranded to emphasize key levels + momentum as the core framework
LMT v2.0
Date: 11/06/2025
- Fully restructured lower timeframe (LTF) momentum logic
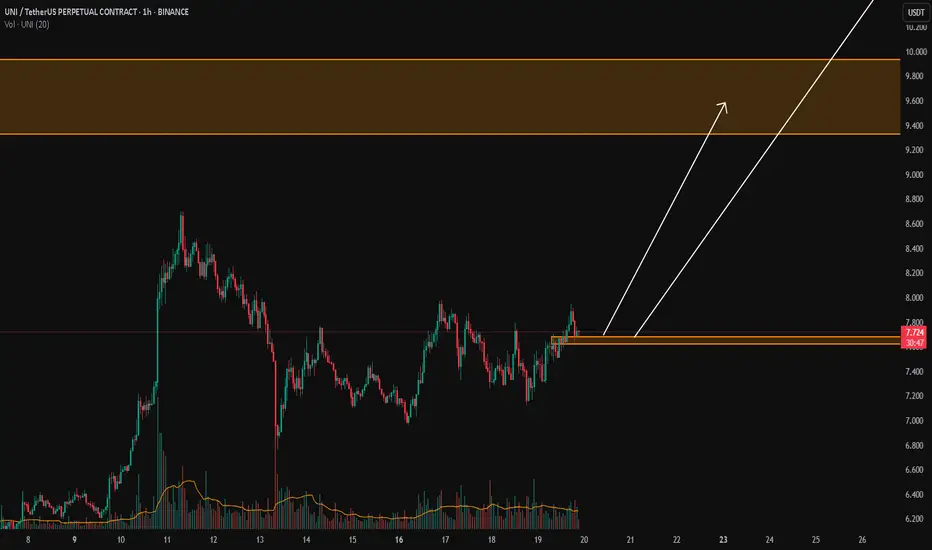

UNI Long Setup – Breakout Retest into High-Confluence SupportUniswap (UNI) has broken out of resistance and is now pulling back into a high-confluence zone, forming a strong bullish structure. The $7.13–$7.73 area presents a favorable entry on the retest.
📌 Trade Setup:
• Entry Zone Around: $7.13 – $7.73
• Take Profit Targets:
o 🥇 $10.50 – $12.85
• Stop Loss: Daily close below $6.50
Uniswap Coin (UNI): Buy Entry Incoming | Be Ready For ExplosionUniswap is showing good signs for potential bullish movement that might happen from here on. The key area is once again the 200 EMA, which historically, once it has been broken and secured, buyers gathered all the volume and sent the price as high as they could.
We are aiming to see same movement like before, when we broke the EMA.
Swallow Academy

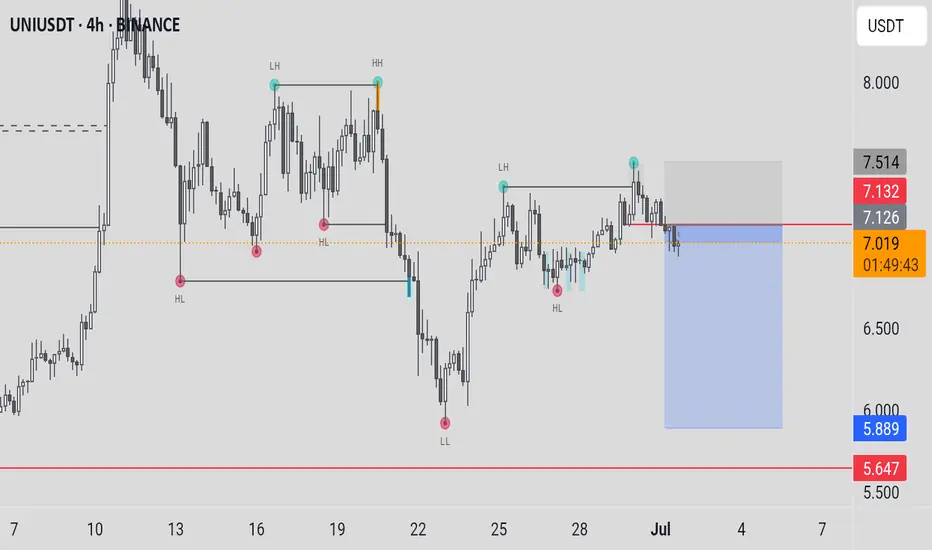
TradeCityPro | UNI Builds Pressure Below Key Resistance Zone👋 Welcome to TradeCity Pro!
In this analysis, I’ll be reviewing the UNI coin — one of the notable DeFi tokens, currently ranked 27th on CoinMarketCap with a market cap of $254 million.
⌛️ 4-Hour Timeframe
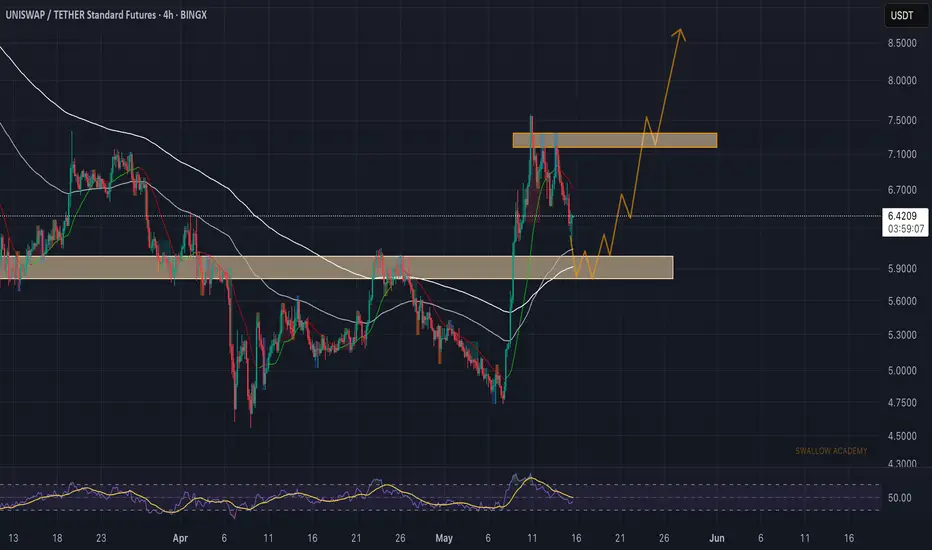
On the 4-hour chart, as you can see, UNI has formed a bottom around the 6.043 level, which is considered its key support zone. After reaching this level, the price began an upward move, though the trend appears very weak.
✔️ Currently, there’s a resistance zone just above the price that has previously caused multiple rejections. Once again, the price is moving toward this zone.
📊 The volume during this latest upward leg is very low, which is not a good sign for initiating a bullish trend. If the price reaches this resistance level with such low volume, there's a high likelihood of another rejection.
🔽 If that happens, we could consider opening a short position based on this rejection. However, my main trigger level for a short is the break below 6.896 — I personally would wait for this level to be breached before entering a short position.
✨ The next key support, in case 6.896 is broken, is the 6.043 zone. This is a major support level and could serve as the target for the short trade. If this level is broken as well, it could mark the beginning of a strong downward trend.
🔍 On the other hand, if volume starts to pick up and the resistance zone is broken, we could open a long position. The target for this could be around 8.678 — or even a setup in anticipation of a breakout above 8.678.
🔔 Which scenario you choose depends largely on your market perspective. If you're looking for a short-term trade, the first scenario is more appropriate. But if you're aiming for a long-term position with a wider stop loss, the second scenario would be the better choice.
💥 In either of the long scenarios, I strongly recommend confirming the move with volume. For further confirmation, you can also check if RSI enters the overbought zone.
📝 Final Thoughts
This analysis reflects our opinions and is not financial advice.
Share your thoughts in the comments, and don’t forget to share this analysis with your friends! ❤️

UNIUSDT Cryptocurrency Futures Market Disclaimer 🚨🚨🚨
Trading cryptocurrency futures involves high risks and is not suitable for all investors.
Cryptocurrency prices are highly volatile, which can lead to significant gains or losses in a short period.
Before engaging in crypto futures trading, consider your risk tolerance, experience, and financial situation.
Risk of Loss: You may lose more than your initial capital due to the leveraged nature of futures. You are fully responsible for any losses incurred.
Market Volatility: Crypto prices can fluctuate significantly due to factors such as market sentiment, regulations, or unforeseen events.
Leverage Risk: The use of leverage can amplify profits but also increases the risk of total loss.
Regulatory Uncertainty: Regulations related to cryptocurrencies vary by jurisdiction and may change, affecting the value or legality of trading.
Technical Risks: Platform disruptions, hacking, or technical issues may result in losses.
This information is not financial, investment, or trading advice. Consult a professional financial advisor before making decisions. We are not liable for any losses or damages arising from cryptocurrency futures trading.
Note: Ensure compliance with local regulations regarding cryptocurrency trading in your region.
thanks for like and follow @ydnldn

Uniswap (UNI): Looking For Successful Re-Test | Bullish MovementUNI coin is approaching the local support zone near the 200EMA, where we had a nice breakout but lacked the proper retest of that zone. We are looking for a successful retest of that zone, which would then open us an opportunity to move back to upper zones, towards the smaller resistance zone (for a breakout).
Swallow Academy