US500 trade ideas

SPX500 Slips Ahead of Key Inflation Data (PCE Report in Focus)SPX500 – Overview
Wall Street Slips Ahead of Key Inflation Data
U.S. stock indices fell on Friday as traders turned cautious ahead of the PCE inflation report, a key release that could shape the Federal Reserve’s September rate decision. Market sentiment remains highly sensitive to incoming data.
🔹 Technical Outlook
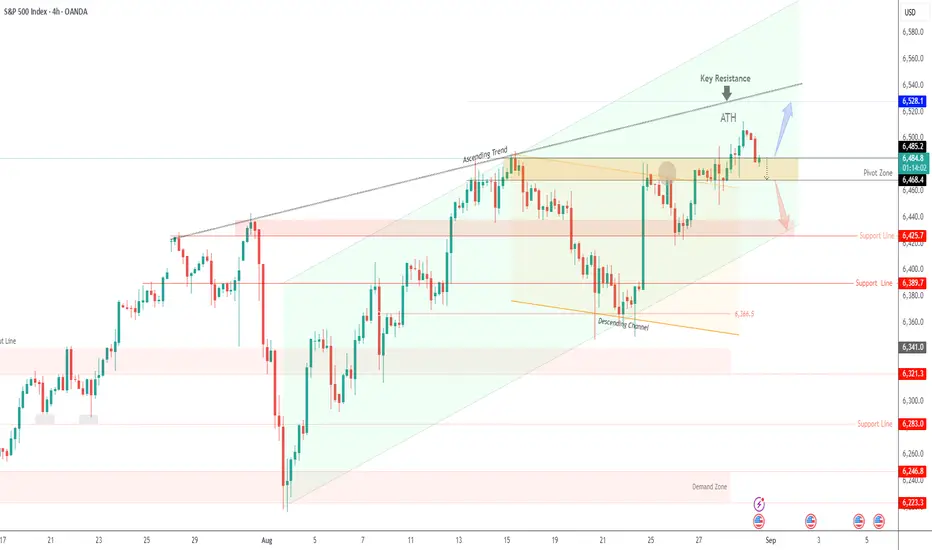
The index is expected to pull back from 6,485 toward 6,468.
✅ A confirmed 1H close below 6,468 would extend the bearish move toward 6,447 → 6,425.
⚠️ However, if price stabilizes above 6,486 (1H/4H close), bullish momentum would resume, with upside targets at 6,506 → 6,528.
🔹 Key Levels
Support: 6,468 – 6,447 – 6,425
Resistance: 6,506 – 6,528
✅ Summary:
SPX500 is consolidating just below resistance as markets await the PCE inflation release. A break below 6,468 would confirm bearish continuation, while holding above 6,486 would reignite bullish momentum.

S&P (CASH500) | 30min Inverse Head & Shoulders | GTradingMethodHello Traders.
Welcome to today’s trade idea by GTradingMethod.
🧐 Market Overview:
Following Friday’s sharp rally after Jackson Hole, the S&P 500 may be forming a bull flag. If confirmed, this setup could drive an equal measured move higher, with the inverse head & shoulders pattern acting as a potential breakout structure.
📊 Trade Plan:
Risk/Reward: 3.6
Entry: 6460.1
Stop Loss: 6453.8
Take Profit 1 (50%): 6481
Take Profit 2 (50%): 6489
💡 GTradingMethod Tip:
Always wait for confirmation of breakout patterns to avoid false moves.
📌 Please note:
This is not financial advice. This content is to track my trading journey and for educational purposes only.

S&P 500 Daily Chart Analysis For Week of August 22, 2025Technical Analysis and Outlook:
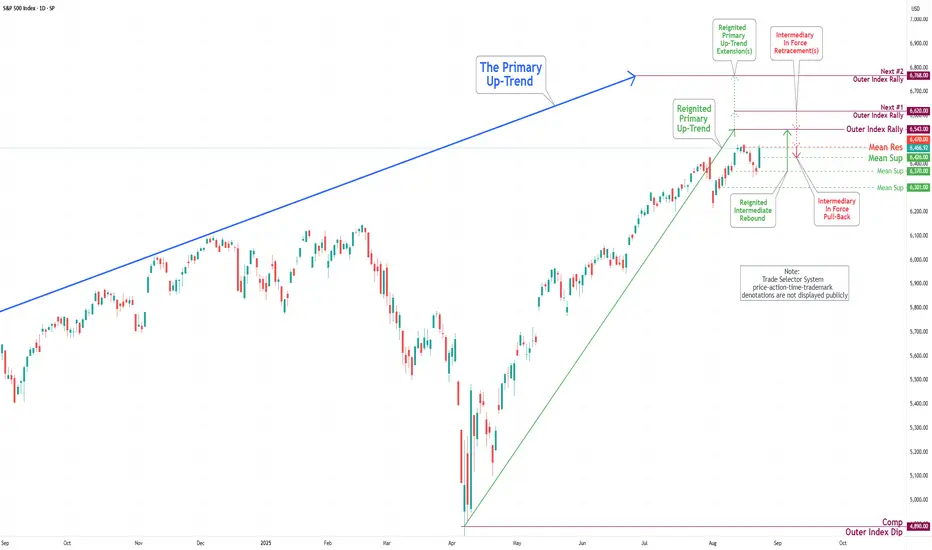
During the trading activity of the previous week, the S&P 500 Index experienced significant volatility before reestablishing its strong bullish trend. Initially, the Index faced a substantial decline, reaching our designated target of Mean Support at 6370. Subsequently, it rebounded vigorously, attaining our target of Mean Resistance at 6470, and is currently aiming for the Outer Index Rally target of 6543. It is essential to recognize, however, that there remains a possibility of a decline to Mean Support at 6426 before the upward trajectory resumes.
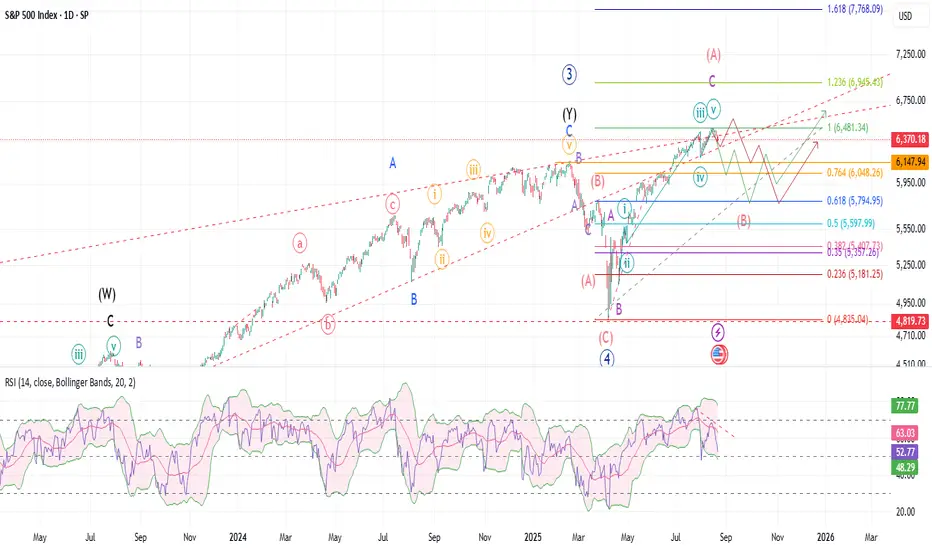
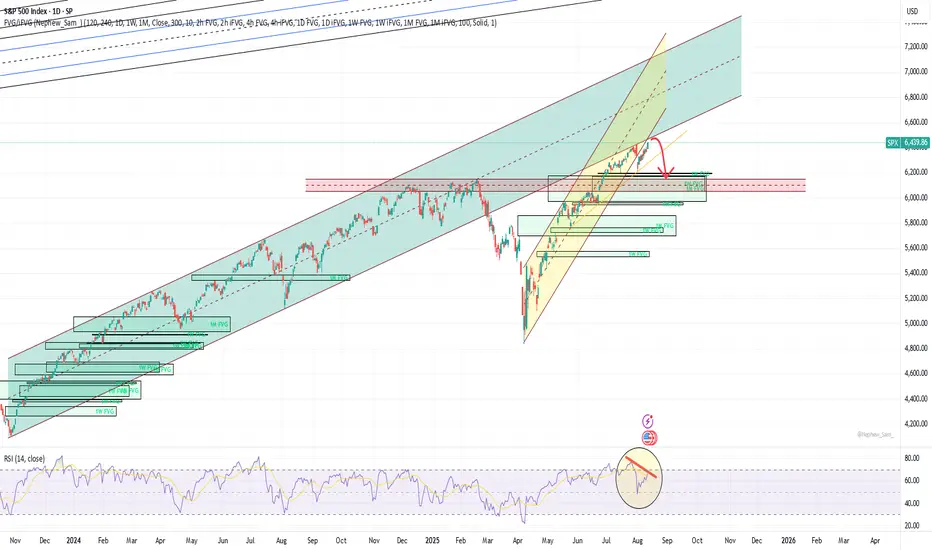
SPX: Bad news if support breaksSPX is coming up on the support area around 6300. Next week will be the do or die test. If support trendline breaks, then probability of Minor degree B wave goes up by a lot. Right now, the bullish scenario is on the red path. If, SPX gets support on the trendline and bounces to make another ATH along with Daily and Weekly RSI making another lower high, then that would be the local top. More bearish scenario is if the support breaks right now. That will put SPX on the green path; breakdown, retest trendline and then crash. In that case, should expect correction to last till the end of September; maybe till mid October, and then the Halloween rally to finish up the year. Should expect market to get down to 0.618 to 0.5 fib level before the down turn is over. Do not want to see the market get below 5k. For now, the trendline is where the next move will most likely be decided. I do not think the generational crash is here just yet. There are still a lot of investors on the side lines. Crypto market still hasn't seen the blow off top. Underlying economy is still holding steady, even though some cracks are appearing. Depending on how the correction unfolds, either a 3 or a 5 waves move, we will find out the magnitude and the degree.
S&P 500 (SPX) – Long-Term Channel & Target ZoneS&P 500 (SPX) – Long-Term Channel & Target Zone
🔹 Technical Overview
The S&P 500 continues to trade within a well-defined ascending channel since the 2020 lows.
The index recently recovered strongly from the 2022 correction and is now approaching the upper half of the channel.
Measured move from the last significant swing suggests potential upside continuation into a higher target zone.
🔹 Key Levels
Support zone: 5,950 – 6,200 (lower channel area).
Major resistance / target zone: 7,729 – 8,837 USD.
Channel resistance: aligns with the upper boundary of the long-term trend channel.
🔹 Interpretation
As long as the index remains inside the ascending channel, the broader trend is bullish.
A confirmed breakout above 7,729 would open the door to test the extended target near 8,837.
Losing the channel support (below 5,900) would signal a deeper correction and invalidate the near-term bullish structure.
🔹 Conclusion
The S&P 500 remains in a structural uptrend, respecting its long-term channel.
The next major upside target zone sits between 7,729 and 8,837 USD, provided the index holds above the 6,000 area.
📝 Quick Key Points
📊 Trading inside a long-term ascending channel.
📍 Support: 5,950–6,200 USD.
📍 Resistance / target zone: 7,729–8,837 USD.
⚠️ Breakdown below 5,900 would negate the bullish outlook.

End of 2025: 3 Fed scenarios and their impact on the marketThe FED has not cut the federal funds rate since the end of 2024. Let's take a look at the 3 possible scenarios for the Fed funds rate between now and the end of the year, and the impact on the stock market for equities, bonds, the US dollar and Bitcoin.
The table below summarizes the 3 possible scenarios and their possible impact on the stock market.
1) No FED pivot for the whole of 2025 (the most bearish case for risky assets on the stock market)
In this case, the FED would keep rates unchanged for the whole of 2025 in order to continue the fight against inflation. The market would find itself trapped by its expectations, as it anticipates an easing by the end of the year. On the stock market, this would trigger a major correction in the S&P 500, currently valued at levels close to its 2021 highs. Two-year interest rates would rebound, as would long-term bond yields, leading to increased pressure on US government debt and lower bond prices. The US dollar is expected to rebound strongly, driven by a technical bullish pattern, reinforcing its attractiveness on the foreign exchange market. Finally, in the crypto-currencies, a sustained bear market would set in, with an estimated average duration of thirteen months (the famous bear market of BTC's 4-year cycle), marking a major reversal for Bitcoin and altcoins.
2) A “technical” pivot by the FED (1 isolated rate cut)
This intermediate scenario would correspond to a cut in key rates as early as September or October 2025, following the arrival of Stephen Miran on the FOMC. However, this cut would remain isolated and would not mark the start of a prolonged rate-cutting cycle, as inflation would still be too high. On the equity markets, this would translate into a consolidation phase: the S&P 500 would move in a corridor between 5800 points and its recent record highs. Two-year yields would stabilize at around 4%, hovering around their 200-day moving average, with a slight rise in bond prices, especially in the event of a weak job market. The US dollar would also stabilize, with a moderate appreciation on the foreign exchange market. As for crypto-currencies, the impact would be neutral to slightly bullish, with the possibility of a final peak before the next bear market settles in, linked to the four-year cycle seen on Bitcoin.
3) A “real” FED pivot (several rate cuts between now and the end of December 2025)
In the case of a real monetary pivot, the FED would cut its key rate in September, followed by two further cuts before the end of the year. This scenario would have a markedly positive impact on equity markets, with the S&P 500 possibly reaching the 6700-point target. On the rates side, this would lead to a marked downtrend, with new lows for short- and long-term yields, while bond prices would start to rise sharply again. The US dollar would enter a prolonged downtrend, with a target of 95 points for the DXY index. Last but not least, crypto-currencies are set to benefit from this accommodating climate: Bitcoin and altcoins are likely to see their prices rise, marking the end of a bullish cycle at the end of the year.
DISCLAIMER:
This content is intended for individuals who are familiar with financial markets and instruments and is for information purposes only. The presented idea (including market commentary, market data and observations) is not a work product of any research department of Swissquote or its affiliates. This material is intended to highlight market action and does not constitute investment, legal or tax advice. If you are a retail investor or lack experience in trading complex financial products, it is advisable to seek professional advice from licensed advisor before making any financial decisions.
This content is not intended to manipulate the market or encourage any specific financial behavior.
Swissquote makes no representation or warranty as to the quality, completeness, accuracy, comprehensiveness or non-infringement of such content. The views expressed are those of the consultant and are provided for educational purposes only. Any information provided relating to a product or market should not be construed as recommending an investment strategy or transaction. Past performance is not a guarantee of future results.
Swissquote and its employees and representatives shall in no event be held liable for any damages or losses arising directly or indirectly from decisions made on the basis of this content.
The use of any third-party brands or trademarks is for information only and does not imply endorsement by Swissquote, or that the trademark owner has authorised Swissquote to promote its products or services.
Swissquote is the marketing brand for the activities of Swissquote Bank Ltd (Switzerland) regulated by FINMA, Swissquote Capital Markets Limited regulated by CySEC (Cyprus), Swissquote Bank Europe SA (Luxembourg) regulated by the CSSF, Swissquote Ltd (UK) regulated by the FCA, Swissquote Financial Services (Malta) Ltd regulated by the Malta Financial Services Authority, Swissquote MEA Ltd. (UAE) regulated by the Dubai Financial Services Authority, Swissquote Pte Ltd (Singapore) regulated by the Monetary Authority of Singapore, Swissquote Asia Limited (Hong Kong) licensed by the Hong Kong Securities and Futures Commission (SFC) and Swissquote South Africa (Pty) Ltd supervised by the FSCA.
Products and services of Swissquote are only intended for those permitted to receive them under local law.
All investments carry a degree of risk. The risk of loss in trading or holding financial instruments can be substantial. The value of financial instruments, including but not limited to stocks, bonds, cryptocurrencies, and other assets, can fluctuate both upwards and downwards. There is a significant risk of financial loss when buying, selling, holding, staking, or investing in these instruments. SQBE makes no recommendations regarding any specific investment, transaction, or the use of any particular investment strategy.
CFDs are complex instruments and come with a high risk of losing money rapidly due to leverage. The vast majority of retail client accounts suffer capital losses when trading in CFDs. You should consider whether you understand how CFDs work and whether you can afford to take the high risk of losing your money.
Digital Assets are unregulated in most countries and consumer protection rules may not apply. As highly volatile speculative investments, Digital Assets are not suitable for investors without a high-risk tolerance. Make sure you understand each Digital Asset before you trade.
Cryptocurrencies are not considered legal tender in some jurisdictions and are subject to regulatory uncertainties.
The use of Internet-based systems can involve high risks, including, but not limited to, fraud, cyber-attacks, network and communication failures, as well as identity theft and phishing attacks related to crypto-assets.

SPX500 Futures Hold Gains Ahead of Nvidia EarningsSPX500 Futures – Overview
Markets Edge Higher Ahead of Nvidia Earnings
U.S. stock futures are trading slightly higher on Wednesday as investors await Nvidia’s earnings after today’s closing bell, seen as a bellwether for global AI demand and overall market sentiment.
🔹 Technical Outlook
Price has stabilized above 6,471, confirming bullish momentum.
As long as it holds above this level, upside targets are 6,484 → 6,512 → 6,528.
✅ A 1H close above 6,484 would reinforce the bullish outlook toward higher resistance.
⚠️ However, if the index reverses and stabilizes below 6,471 (1H close), this would trigger a bearish correction toward 6,447.
🔹 Key Levels
Pivot: 6,471
Resistance: 6,484 – 6,512 – 6,528
Support: 6,447 – 6,425 – 6,390
✅ Summary:
SPX500 futures are consolidating in bullish territory ahead of Nvidia earnings. A breakout above 6,484 would extend upside momentum, while a drop back below 6,471 risks a correction toward 6,447.

SPX500 Hits 6,495 Before Pullback, Key Pivot at 6,468SPX500 Futures – Overview
The S&P 500 continues to record new highs, peaking at 6,495 before pulling back for a correction.
Price action has since settled above 6,485 on the 4H candle — the previous high — and is now correcting back toward this level, preparing for a potential new upward move.
🔹 Technical Outlook
Holding above 6,485 will support bullish continuation toward 6,512 → 6,528 new ATH.
⚠️ A break below 6,485 and a confirmed 1H close under 6,468 (pivot) would signal a new decline toward 6,425 support.
Key Levels
Pivot: 6,468
Resistance: 6,512 – 6,528
Support: 6,485 – 6,468 – 6,438 – 6,425
✅ Summary:
SPX500 remains in a bullish structure after reaching new highs. Watch 6,485 as the key decision level — holding above favors continuation higher, while a drop below 6,468 could trigger a deeper correction.


SPX500 H4 | Bearish dropS&P500 has rejected off the sell entry at 6,407.74, which is a pullback resistance that aligns with the 38.2% Fibonacci retracement and could drop from this level to the downside.
Stop is at 6,491.06, which is a swing high resistance.
Take profit is at 6,302.91, which is a pullback support that is slightly below the 61.8% Fibonacci retracement.
High Risk Investment Warning
Trading Forex/CFDs on margin carries a high level of risk and may not be suitable for all investors. Leverage can work against you.
Stratos Markets Limited (tradu.com ):
CFDs are complex instruments and come with a high risk of losing money rapidly due to leverage. 65% of retail investor accounts lose money when trading CFDs with this provider. You should consider whether you understand how CFDs work and whether you can afford to take the high risk of losing your money.
Stratos Europe Ltd (tradu.com ):
CFDs are complex instruments and come with a high risk of losing money rapidly due to leverage. 66% of retail investor accounts lose money when trading CFDs with this provider. You should consider whether you understand how CFDs work and whether you can afford to take the high risk of losing your money.
Stratos Global LLC (tradu.com ):
Losses can exceed deposits.
Please be advised that the information presented on TradingView is provided to Tradu (‘Company’, ‘we’) by a third-party provider (‘TFA Global Pte Ltd’). Please be reminded that you are solely responsible for the trading decisions on your account. There is a very high degree of risk involved in trading. Any information and/or content is intended entirely for research, educational and informational purposes only and does not constitute investment or consultation advice or investment strategy. The information is not tailored to the investment needs of any specific person and therefore does not involve a consideration of any of the investment objectives, financial situation or needs of any viewer that may receive it. Kindly also note that past performance is not a reliable indicator of future results. Actual results may differ materially from those anticipated in forward-looking or past performance statements. We assume no liability as to the accuracy or completeness of any of the information and/or content provided herein and the Company cannot be held responsible for any omission, mistake nor for any loss or damage including without limitation to any loss of profit which may arise from reliance on any information supplied by TFA Global Pte Ltd.
The speaker(s) is neither an employee, agent nor representative of Tradu and is therefore acting independently. The opinions given are their own, constitute general market commentary, and do not constitute the opinion or advice of Tradu or any form of personal or investment advice. Tradu neither endorses nor guarantees offerings of third-party speakers, nor is Tradu responsible for the content, veracity or opinions of third-party speakers, presenters or participants.

SPX500 & NAS100 AT RESISTANCE CROSSROADS, GOLD GAINING STEAMIn this weekend's analysis on the SPX500 and NAS100 indices, I see a potential bullish trend continuation but also at a key resistance level with hidden bears ready to attach bulls. This is one of the setups that patience is more rewarding than taking a bet.
Gold is gaining strength to the upper range and still in the sideways channel. Here too patience for a clear breakout will be more rewarding. I think based on the length of the sideways, once there is a clear breakout, Gold will really rally to it's next targets. Please watch the entire video to understand my analysis and thoughts. Cheers and have a great trading week.

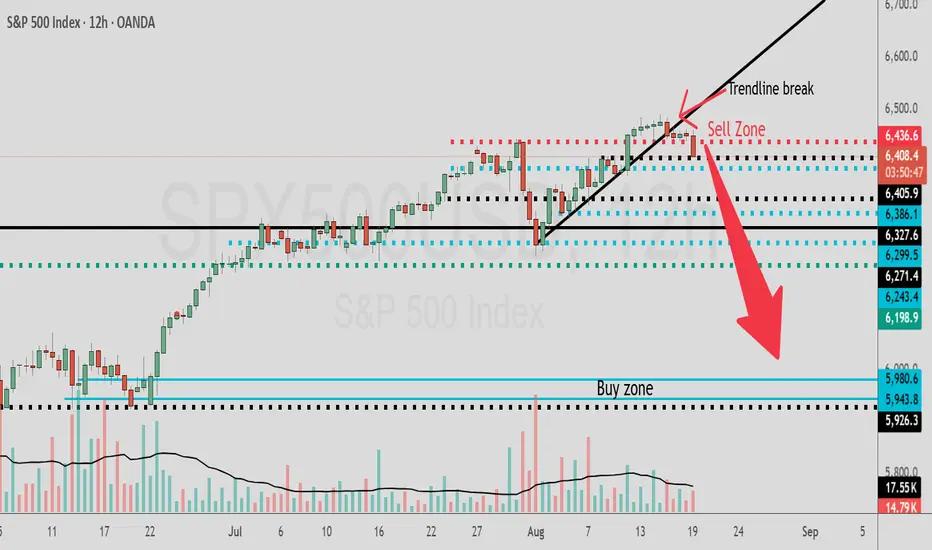
Trendline Break To The Downside In SPX/USDHey Traders and followers! Hope your summer has been going great along with your profits $
Take your money off the table in SPX if you are long and jump into a short as we have a trendline break to the downside on the 12hr chart.
Price has broke through the sell zone area of 6436.6 painting a bearish picture for SPX way down to 5980.6 area.
If price breaks back up above 6436.6 area then the bearish break trade will be off the table.
Best of luck in all your trades $$$

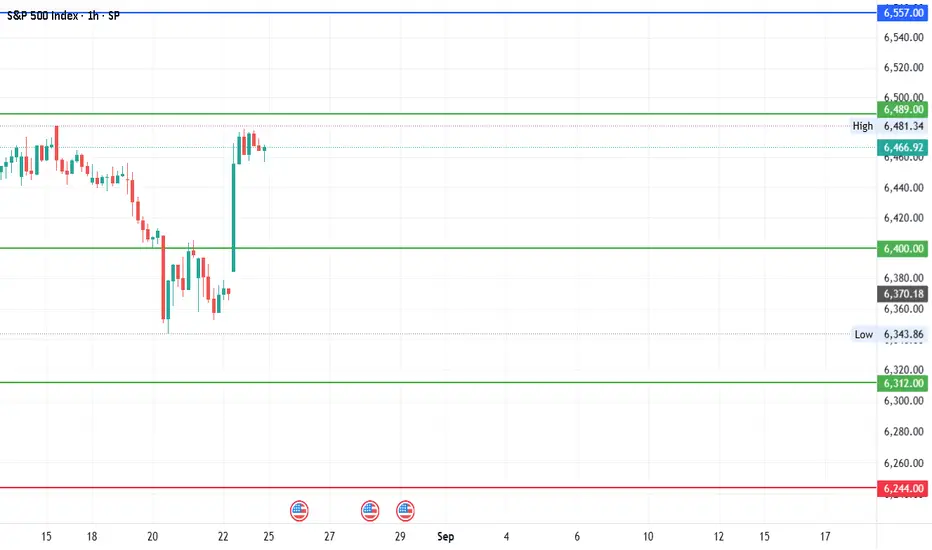
#SPX - 300 points move?Date: 24-08-2025
SPX- Current Price: 6466.92
Pivot Point: 6400
Support: 6312
Resistance: 6489
Upside Targets:
--------------------------------
| Target | Price |
---------------------------------
| 🎯 Target 1 | 6557 |
| 🎯 Target 2 | 6625 |
| 🎯 Target 3 | 6710 |
| 🎯 Target 4 | 6794 |
Downside Targets:
| 🎯 Target 1 | 6244 |
| 🎯 Target 2 | 6175 |
| 🎯 Target 3 | 6090 |
| 🎯 Target 4 | 6006 |
#TradingView #Nifty #BankNifty #DJI #NDQ #SENSEX #DAX #USOIL #GOLD #SILVER
#BHEL #HUDCO #LT #LTF #ABB #DIXON #SIEMENS #BALKRISIND #MRF #DIVISLAB
#MARUTI #HAL #SHREECEM #JSWSTEEL #MPHASIS #NATIONALUM #BALRAMCHIN #TRIVENI
#USDINR #EURUSD #USDJPY #NIFTY_MID_SELECT #CNXFINANCE
#SOLANA #ETHEREUM #BTCUSD #MATICUSDT #XRPUSDT #PEPEUSDT #SHIBUSDT
#Crypto #Bitcoin #BTC #CryptoTA #TradingView #PivotPoints #SupportResistance
US500: Bulls Pause as Pullback Risks GrowUS500 has been riding an impressive uptrend, with buyers pushing the index to fresh highs above 6,440, but the recent stalling near resistance suggests that momentum may be losing steam. With growth concerns, central bank caution, and a round of key economic data on deck, the risk of a corrective pullback is building. This setup highlights the importance of watching whether support levels hold or if sellers gain the upper hand.
Current Bias
Bearish (Short Term) – While the broader trend remains bullish, near-term technicals and macro uncertainty point toward a corrective pullback.
Key Fundamental Drivers
US Earnings Season: Mixed corporate earnings, with strength in tech offset by weakness in cyclicals.
Fed Policy: Markets are still weighing timing of potential rate cuts, but sticky inflation data and cautious Fed commentary keep rates elevated.
Bond Yields: US yields remain relatively high, pressuring equities when safe-haven flows emerge.
Macro Context
Interest Rates: The Fed is in a “wait-and-see” mode, balancing sticky services inflation against slowing growth. Rate cuts are still priced for later this year, but not aggressively.
Economic Growth: US economy shows signs of slowing, with softer retail sales and housing data, though labor markets remain resilient.
Commodities/Flows: Energy costs are stabilizing, but higher oil prices in recent weeks could add inflationary pressure.
Geopolitics: Trade tensions, tariffs, and Middle East instability add layers of risk, supporting defensive positioning.
Primary Risk to the Trend
A surprise dovish shift from the Fed or stronger-than-expected US earnings could quickly reignite bullish momentum and push US500 higher, invalidating the pullback scenario.
Most Critical Upcoming News/Event
FOMC Minutes & Powell Speeches – Markets will look for clarity on rate cut timing.
US CPI & PPI Data – Any upside surprises could weigh heavily on equities.
Leader/Lagger Dynamics
The US500 is a leader, often dictating global equity sentiment. Movements in US500 ripple into NASDAQ, DAX, FTSE, and risk-sensitive FX pairs such as AUD/JPY. Its role as a global risk benchmark makes it highly influential.
Key Levels
Support Levels: 6,370, 6,231, 5,920
Resistance Levels: 6,447 (recent high), 6,500 psychological barrier
Stop Loss (SL): 6,480 (above recent highs)
Take Profit (TP):
TP1: 6,370
TP2: 6,231
TP3: 5,920
Summary: Bias and Watchpoints
US500 bias is shifting to neutral-to-bearish, with the index showing signs of fatigue at highs around 6,440–6,450. A pullback toward 6,370 → 6,231 is possible, with 5,920 as an extended target if risk sentiment deteriorates. A protective stop at 6,480 is key in case bulls regain momentum. Traders should keep a close eye on Fed communication and US inflation data, as these remain the most powerful catalysts for near-term direction. With the US500 acting as a leader for global equities, its moves will likely shape broader market sentiment across stocks, indices, and even risk-sensitive currencies.


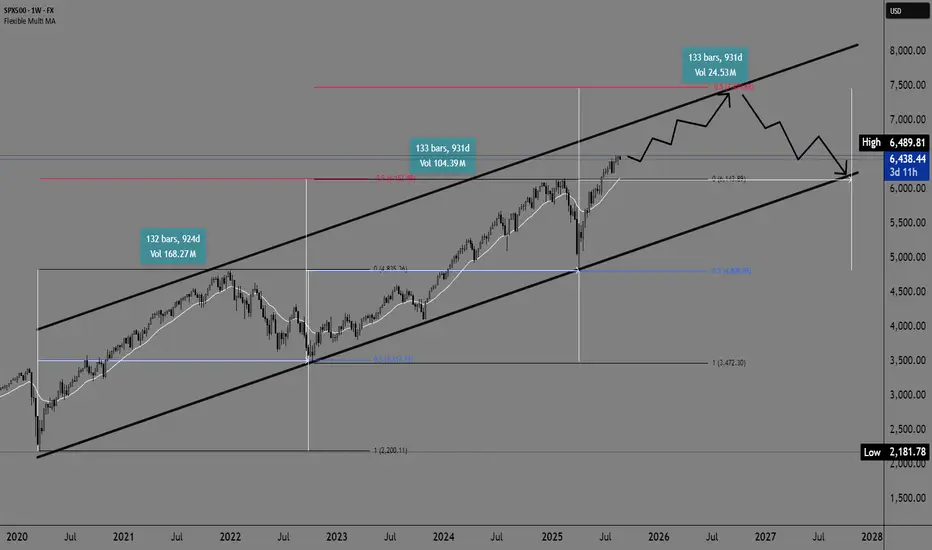
SPX500 Weekly Trend AnalysisSPX500 Weekly Trend Analysis
The SPX500 on a weekly timeframe continues to show an upward trend within a rising channel that has been in place since 2020. The price behavior in relation to the 50.0% Fibonacci retracement levels is particularly interesting—the previous two pullbacks both stopped at this key level, confirming its significant role as support.
As a reminder, after forming a low in 2020, the SPX500 entered a long bullish trend that lasted until December 2021, when it recorded its first high at 4500.00. After that, the index pulled back to the 50.0% Fibonacci level and then continued with a new bullish rally.
A new higher high was formed around 6000.00, which is again connected to the -50.0% Fibonacci level. The next pullback, similar to the previous one, found support at the 50.0% Fibonacci retracement, suggesting a continuation of the upward trend.
Based on this pattern, there is a realistic possibility of a new bullish rally with a potential target of 7500.00 (-50.0% Fibonacci level). Following the previous cycles from low to high and pullback, the average interval is approximately 920–930 days, which provides a rough time projection:
Next high: By the end of 2026
Next pullback: First part of 2027 or, at the latest, by October 2027
This pattern confirms the strong long-term growth structure and implies that the SPX500 will likely maintain its positive momentum for several more years, with periodic corrections that rely on key Fibonacci levels.
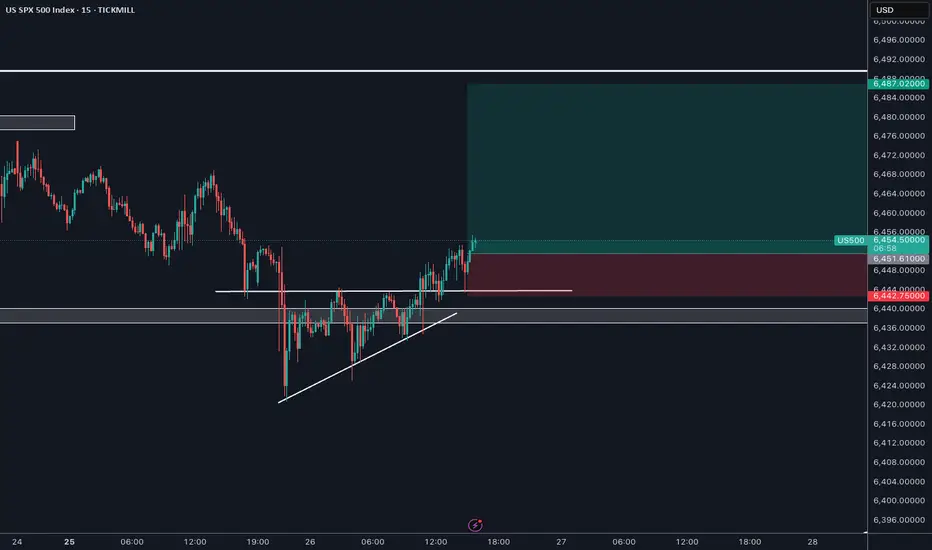
US500 breaks consolidation, eyeing all-time highs after pullbackThe US500 reached a key support area on the H1 chart and started building a bullish structure.
On the intraday (M5/M1), price broke above local resistance and then retested the breakout zone with a clean pullback. This retest was confirmed by a strong bullish candle, signaling continuation to the upside.
Trade plan:
Entry: after confirmation of the pullback at the breakout zone.
Stop-loss: below support (around 6437).
Target: all-time high zone at 6485–6490.
Risk management: once the first target is reached, stop can be moved to breakeven to protect capital.
This setup supports the expectation of bullish continuation, as long as support holds.

SNP500 ShortThis is against the H4 trend; however there is very good resistance at this level, as it is the all-time high and contesting the previous week's high.
There is a pattern on M15 to show a potential reversal zone.
Multiple tops on M15 to H1 with divergence and showing the trends flattening out.
This is against the trend so look to get out at M15 oversold
