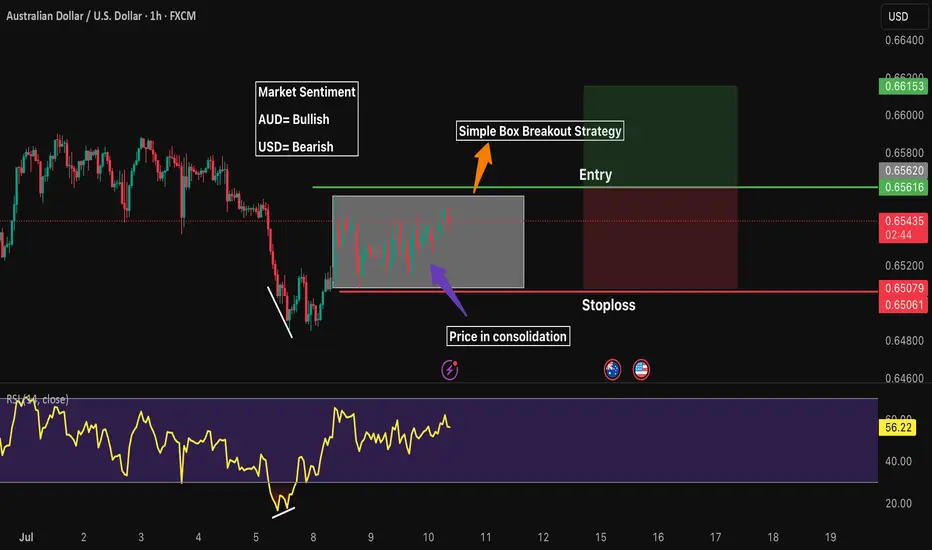
AUDUSD Bearish Breakout!
HI,Traders !
AUD-USD is trading in a sideways trend
and the pair
Made a breakout of the
Key horizontal level
Of 0.8149 which is now
A resistance and the pair
Is now making a retest
Of the level so as we are
Bearish biased we will
Be expecting a pullback
And a further bearish
Move down !
Comment and subscribe to help us grow !
U.S. Dollar / Australian Dollar
1.5192AUDR
+0.0010+0.06%
As of today at 14:26 GMT
AUD
No trades
USDAUD trade ideas

Could the Aussie reverse from here?The price is rising towards the resistance level which is a pullback resistance that lines up with the 61.8% Fibonacci retracement and could drop from this level to our take profit.
Entry: 0.6650
Why we like it:
There is a pullback resistance that lines up with the 61.8% Fibonacci retracement.
Stop loss: 0.6588
Why we like it:
There is a pullback resistance.
Take profit: 0.6481
Why we like it:
There is a pullback support.
Enjoying your TradingView experience? Review us!
Please be advised that the information presented on TradingView is provided to Vantage (‘Vantage Global Limited’, ‘we’) by a third-party provider (‘Everest Fortune Group’). Please be reminded that you are solely responsible for the trading decisions on your account. There is a very high degree of risk involved in trading. Any information and/or content is intended entirely for research, educational and informational purposes only and does not constitute investment or consultation advice or investment strategy. The information is not tailored to the investment needs of any specific person and therefore does not involve a consideration of any of the investment objectives, financial situation or needs of any viewer that may receive it. Kindly also note that past performance is not a reliable indicator of future results. Actual results may differ materially from those anticipated in forward-looking or past performance statements. We assume no liability as to the accuracy or completeness of any of the information and/or content provided herein and the Company cannot be held responsible for any omission, mistake nor for any loss or damage including without limitation to any loss of profit which may arise from reliance on any information supplied by Everest Fortune Group.

AUD_USD WILL GO UP|LONG|
✅AUD_USD has retested a key support level of 0.6540
And as the pair is already making a bullish rebound
A move up to retest the supply level above at 0.6584 is likely
LONG🚀
✅Like and subscribe to never miss a new idea!✅
Disclosure: I am part of Trade Nation's Influencer program and receive a monthly fee for using their TradingView charts in my analysis.

AUDUSD SHORT FORECAST Q3 D10 W28 Y25AUDUSD SHORT FORECAST Q3 D10 W28 Y25
Professional Risk Managers👋
Welcome back to another FRGNT chart update📈
Diving into some Forex setups using predominantly higher time frame order blocks alongside confirmation breaks of structure.
Let’s see what price action is telling us today! 👀
💡Here are some trade confluences📝
✅Daily Order block identified
✅4H Order Block identified
✅1H Order Block identified
🔑 Remember, to participate in trading comes always with a degree of risk, therefore as professional risk managers it remains vital that we stick to our risk management plan as well as our trading strategies.
📈The rest, we leave to the balance of probabilities.
💡Fail to plan. Plan to fail.
🏆It has always been that simple.
❤️Good luck with your trading journey, I shall see you at the very top.
🎯Trade consistent, FRGNT X

AUDUSD Today July 8th 2025, the Reserve Bank of Australia (RBA) is widely expected to announce a 25 basis point cut in the official cash rate, lowering it from 3.85% to 3.60%. This would be the third rate cut in 2025, reflecting easing inflation and a slowing economy.
Key Details for July 8, 2025:
2:30 AM WAT:
Release of NAB Business Confidence data for Australia.
5:30 AM WAT:
Announcement of the RBA Cash Rate decision, expected to be cut to 3.60% from 3.85%.
Release of the RBA Rate Statement, outlining the rationale behind the decision.
RBA Press Conference follows, providing further insights and answering questions.
Market Expectations and Impact:
Major banks including Westpac, Commonwealth Bank, NAB, and ANZ unanimously forecast this 25 bps cut due to softer inflation and subdued economic growth.
The rate cut is expected to ease borrowing costs, potentially saving mortgage holders .
The RBA aims to balance supporting growth while maintaining inflation within its 2–3% target band.
Summary Timeline (WAT)
Time Event Expected Outcome
2:30 AM NAB Business Confidence Indicator of business sentiment
5:30 AM RBA Cash Rate Announcement Cut from 3.85% to 3.60%
5:30 AM RBA Rate Statement Explanation of decision
5:30 AM RBA Press Conference Q&A and further guidance
This rate cut is part of a broader easing cycle, with markets pricing in multiple cuts through the rest of 2025 as inflation remains manageable but economic growth slows.
2. 10-Year Government Bond Yields
Australia 10-Year Bond Yield: Has been falling in 2025 alongside expectations of RBA rate cuts,
AU10Y=4.232%
OCR=3.85% TO TRIM IT TO 3.60% TODAY.
US10Y=4.383%
USD IRT=4.25%-4.5%
3. Interest Rates
Reserve Bank of Australia (RBA) Cash Rate: Recently cut from 3.85% to 3.60% in July 2025, with expectations of further easing (potentially down to ~3.6% by year-end).
US Federal Reserve Rate: Held steady at 4.25%–4.50% as of mid-2025, with a slower pace of cuts compared to Australia.
4. Interest Rate Differential and Impact on AUD/USD
The interest rate differential (US rate minus Australian rate) currently favors the US by approximately 0.65–0.9 percentage points (Fed rate ~4.25–4.50% vs. RBA ~3.60%).
This narrowing differential from earlier wider gaps has weighed on the AUD, as higher US rates attract capital flows, supporting the USD.
However, the recent RBA rate cuts and easing inflation in Australia have softened the differential, giving some support to the AUD.
Other factors influencing AUD/USD include US tariffs, China’s economic outlook (as Australia’s key trading partner), and global risk sentiment.
The AUD/USD is expected to remain sensitive to the interest rate differential and central bank policies.
Further RBA cuts could weaken the AUD if the US Fed maintains higher rates.
Conversely, any signs of US rate cuts or easing trade tensions could boost the AUD.
Inflation trends, China’s economic health, and geopolitical factors will also play key roles.
In essence:
The interest rate differential between the US and Australia currently favors the US, supporting the USD over the AUD, but recent RBA easing and falling Australian bond yields have narrowed this gap, providing some support to the AUD/USD pair . Traders closely watch upcoming economic data and central bank decisions for direction.
#AUDUSD #RBA #FEDS #BONDS #AU10Y #US10Y

AUD/USD Struggles at ResistanceAUD/USD is now nearly 1.6% off the highs with the weekly opening-range taking shape just below Fibonacci resistance- looking for a potential breakout in the days ahead.
A look at Aussie price action shows AUD/USD reversing pitchfork resistance with the weekly opening-range taking shape just below resistance at the 61.8% retracement of the 2024 decline / weekly open at 6550/53- looking for a reaction off this mark.
A top-side breach of the weekly opening-range exposes the upper parallel again, currently near ~6600. Ultimately, a close above the September low at 6622 is needed to fuel the next major leg of the advance with subsequent resistance objectives eyed at the 2019 low at 6671 and the 78.6% retracement near 6723.
Initial support rests with the June low-day close (LDC) at 6458- note that the 75% parallel converges on this threshold into the close of the week and a break / close below would threaten a larger Aussie pullback. Subsequent support objectives rest at the 200-day moving average (currently ~6411) and 6332/62- a region defined by the 38.2% retracement of the yearly range, the April / August 2024 lows, and the May swing low. Losses beyond this threshold would suggest a more significant high is in place / larger reversal is underway.
Bottom line: The Aussie rally failed into the trendline resistance with the monthly opening-range taking shape just below. While the broader outlook is still constructive, the advance remains vulnerable here and the immediate focus is on a breakout of the weekly range (6486-6553) for guidance. From a trading standpoint, losses would need to be limited to 6458 IF Aussie is heading for a breakout on this stretch with a close above 6622 needed to mark uptrend resumption.
-MB

Heading into pullback resistance?The Aussie (AUD/USD) is rising towards the pivot and could reverse to the 1st support which is an overlap support.
Pivot: 0.6587
1st Support: 0.6492
1st Resistance: 0.6634
Risk Warning:
Trading Forex and CFDs carries a high level of risk to your capital and you should only trade with money you can afford to lose. Trading Forex and CFDs may not be suitable for all investors, so please ensure that you fully understand the risks involved and seek independent advice if necessary.
Disclaimer:
The above opinions given constitute general market commentary, and do not constitute the opinion or advice of IC Markets or any form of personal or investment advice.
Any opinions, news, research, analyses, prices, other information, or links to third-party sites contained on this website are provided on an "as-is" basis, are intended only to be informative, is not an advice nor a recommendation, nor research, or a record of our trading prices, or an offer of, or solicitation for a transaction in any financial instrument and thus should not be treated as such. The information provided does not involve any specific investment objectives, financial situation and needs of any specific person who may receive it. Please be aware, that past performance is not a reliable indicator of future performance and/or results. Past Performance or Forward-looking scenarios based upon the reasonable beliefs of the third-party provider are not a guarantee of future performance. Actual results may differ materially from those anticipated in forward-looking or past performance statements. IC Markets makes no representation or warranty and assumes no liability as to the accuracy or completeness of the information provided, nor any loss arising from any investment based on a recommendation, forecast or any information supplied by any third-party.

Bullish bounce off pullback support?The Aussie (AUD/USD) is falling towards the pivot which acts as a pullback support and could bounce to the 1st resistance.
Pivot: 0.6423
1st Support: 0.6328
1st Resistance: 0.6583
Risk Warning:
Trading Forex and CFDs carries a high level of risk to your capital and you should only trade with money you can afford to lose. Trading Forex and CFDs may not be suitable for all investors, so please ensure that you fully understand the risks involved and seek independent advice if necessary.
Disclaimer:
The above opinions given constitute general market commentary, and do not constitute the opinion or advice of IC Markets or any form of personal or investment advice.
Any opinions, news, research, analyses, prices, other information, or links to third-party sites contained on this website are provided on an "as-is" basis, are intended only to be informative, is not an advice nor a recommendation, nor research, or a record of our trading prices, or an offer of, or solicitation for a transaction in any financial instrument and thus should not be treated as such. The information provided does not involve any specific investment objectives, financial situation and needs of any specific person who may receive it. Please be aware, that past performance is not a reliable indicator of future performance and/or results. Past Performance or Forward-looking scenarios based upon the reasonable beliefs of the third-party provider are not a guarantee of future performance. Actual results may differ materially from those anticipated in forward-looking or past performance statements. IC Markets makes no representation or warranty and assumes no liability as to the accuracy or completeness of the information provided, nor any loss arising from any investment based on a recommendation, forecast or any information supplied by any third-party.

#AUDUSD:We are yet to see weaken USD! AUDUSD to make yearly highAUDUSD hasn’t seen strong bullish volume yet, but tomorrow’s NFP will be crucial for determining the future trend of the AUDUSD. Based on your analysis, you can set multiple targets.
If you like our work and want to support us, you can do so by following us:
-Liking our ideas
-Commenting on our ideas
-Sharing
Team Setupsfx_
❤️🚀

AUD/USD: Short Setup to 0.6450This trade idea is rooted in a data-driven approach, leveraging a rare asymmetry in the economic calendar and specific quantitative models to identify a high-clarity opportunity.
📊 The Thesis by the Numbers
My model assigns clear probabilities to the potential scenarios for this week, based on the scheduled U.S. data releases.
60% Probability: Base Case (USD Strength). Triggered by a U.S. Core CPI reading at or above 0.3% MoM.
30% Probability: Alternative Case (USD Weakness).
10% Probability: Wildcard Scenario (Risk-On Rally).
🧠 The Data-Driven Rationale
This setup scored a -5 on my quantitative thesis model, indicating a strong bearish conviction. The core of this is the one-sided event risk. With Australia's calendar completely empty, the AUD is a sitting duck. Meanwhile, a volley of tier-one U.S. data (CPI, PPI, Retail Sales) is expected to confirm a robust economy. This fundamental divergence, combined with a technical picture of price coiling below long-term resistance, creates the conditions for a catalyst-driven drop.
⛓️ Intermarket & Statistical Edge
Further analysis of market correlations and forward-looking models reinforces the bearish bias.
🌐 Correlations: The positive correlation of AUD/USD with equities (SPY: +0.31) suggests that a strong USD report, which could pressure stocks, would create a direct headwind for the Aussie.
🎲 Monte Carlo Simulation: While the mean outcome is neutral, the model's 5th percentile for price is down at 0.6503 , highlighting the statistical risk of a significant downside move if the catalyst fires.
✅ The Trade Setup
📉 Bias: Bearish / Short
👉 Entry: Watch for a bearish reversal pattern on the 1H or 4H chart within the $0.6550 resistance zone.
⛔️ Stop Loss: A decisive daily close above the 0.6622 resistance level.
🎯 Target: 0.6458 (June low-day close).
Good luck, and trade safe.

AUDUSDOverall bearish market structure in the higher time frames
- High wicks exhausting the buyers ( sellers stepping in? )
- RSI crossing over ( potential for a market direction change )
- Testing Supply zone but failing to break through
- Tested Major Fib levels and currently consolidation and unable to break through
- Currently in the 30 minute time frame is this the retracement to then fall towards the downsides
- Stop Loss is placed from the ATR number which was 32.
- Take Profit at next demand zone
Any questions or wanting to follow more of my trades, don't hesitate to drop me a message

AUDUSD good structure for higher bullish
OANDA:AUDUSD whats next, we are have DESCENDING CHANNEL breaked, its followed by bullish push, but its not make to much in my op, at end price is make revers, its stop at end on strong sup zone (0.64900).
We are have in last day-two RBA and RBNZ today, price is start pushing looks like zone 0.64900 can be taked for valid zone, from which now expecting higher bullish push in next periods.
SUP zone: 0.65100
RES zone: 0.66300, 0.66600

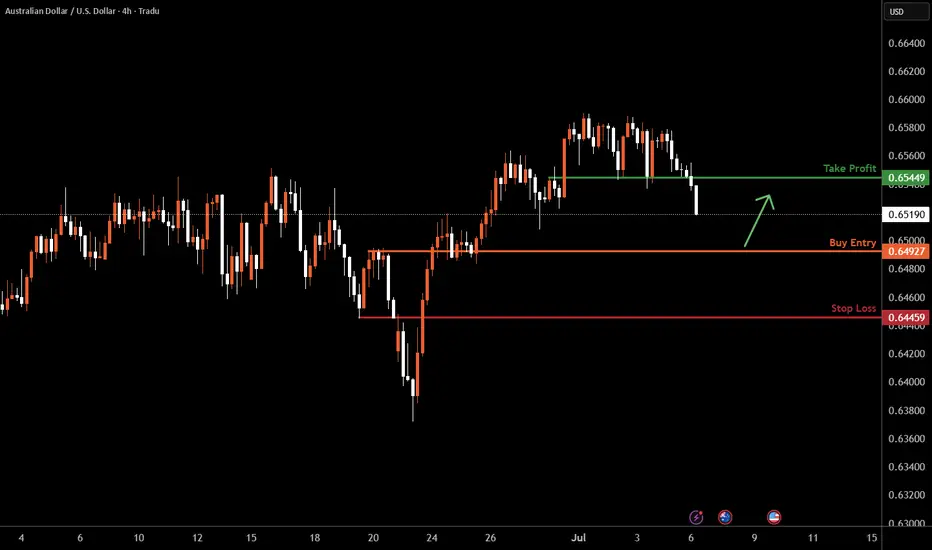
AUDUSD H4 I Bullish Bounce Based on the H4 chart analysis, the price is falling our buy entry level at 0.6492, a pullback support.
Our take profit is set at 0.6544, a pullback resistance.
The stop loss is placed at 0.6445, a pullback support.
High Risk Investment Warning
Trading Forex/CFDs on margin carries a high level of risk and may not be suitable for all investors. Leverage can work against you.
Stratos Markets Limited (tradu.com ):
CFDs are complex instruments and come with a high risk of losing money rapidly due to leverage. 63% of retail investor accounts lose money when trading CFDs with this provider. You should consider whether you understand how CFDs work and whether you can afford to take the high risk of losing your money.
Stratos Europe Ltd (tradu.com ):
CFDs are complex instruments and come with a high risk of losing money rapidly due to leverage. 63% of retail investor accounts lose money when trading CFDs with this provider. You should consider whether you understand how CFDs work and whether you can afford to take the high risk of losing your money.
Stratos Global LLC (tradu.com ):
Losses can exceed deposits.
Please be advised that the information presented on TradingView is provided to Tradu (‘Company’, ‘we’) by a third-party provider (‘TFA Global Pte Ltd’). Please be reminded that you are solely responsible for the trading decisions on your account. There is a very high degree of risk involved in trading. Any information and/or content is intended entirely for research, educational and informational purposes only and does not constitute investment or consultation advice or investment strategy. The information is not tailored to the investment needs of any specific person and therefore does not involve a consideration of any of the investment objectives, financial situation or needs of any viewer that may receive it. Kindly also note that past performance is not a reliable indicator of future results. Actual results may differ materially from those anticipated in forward-looking or past performance statements. We assume no liability as to the accuracy or completeness of any of the information and/or content provided herein and the Company cannot be held responsible for any omission, mistake nor for any loss or damage including without limitation to any loss of profit which may arise from reliance on any information supplied by TFA Global Pte Ltd.
The speaker(s) is neither an employee, agent nor representative of Tradu and is therefore acting independently. The opinions given are their own, constitute general market commentary, and do not constitute the opinion or advice of Tradu or any form of personal or investment advice. Tradu neither endorses nor guarantees offerings of third-party speakers, nor is Tradu responsible for the content, veracity or opinions of third-party speakers, presenters or participants.

AUDUSDTHE month July 8, 2025, the key Australian economic events
2:30 AM WAT – NAB Business Confidence
Actual: 5
Forecast: 2
The NAB Business Confidence Index rose sharply to 5 in June 2025 from 2 in May, marking its highest level since January and indicating improving business sentiment. This improvement was driven by gains in sales, profitability, and employment, signaling optimism about the economic outlook despite some lingering cost pressures.
5:30 AM WAT – RBA Cash Rate and Related Announcements
Cash Rate Actual: 3.85% (no cut at this meeting)
Forecast: 3.60% (markets had expected a 25 bps cut)
Previous: 3.85%
The Reserve Bank of Australia (RBA) held the cash rate steady at 3.85%, surprising markets that had expected a cut to 3.60%. The RBA Rate Statement accompanied the decision, providing insights into the bank’s view on inflation, growth, and monetary policy. The decision reflects the RBA’s cautious stance amid mixed economic signals and ongoing inflation concerns.
The stronger business confidence contrasted with the RBA’s decision to pause rate cuts, highlighting uncertainty about the economic outlook and inflation trajectory in Australia.
AU10Y=ROSE TO 4.3% FROM DAILY OPEN OF 4.206%
AUD OCR=3.85% THE SAME
US10Y=4.391%
US IRT=4.25-4.5%
This shift in AU1OY and RATE hold of 3.85% will give AUD a buy opportunity going forward.
while we are seeing tariff related shocks evident ,AUSTRALIA a commodities dependent economy will take a offensive .
The announcement and implementation of tariffs have created uncertainty, causing the AUD to decline from recent highs. The AUD/USD pair dropped in anticipation of tariff changes and broader risk aversion in global markets.
Market Sentiment:
The threat of higher tariffs and trade tensions typically weighs on the AUD, as Australia’s economy is highly exposed to global trade flows. Increased tariffs can reduce export competitiveness and hurt terms of trade, especially if global growth slows as a result.
Limited Direct Impact:
since the US is not Australia’s largest export market. However, indirect effects—such as slower global growth or disruptions in China (Australia’s biggest trading partner)—could further pressure the AUD.
Broader Economic and Policy Context
RBA Response:
The Reserve Bank of Australia (RBA) has cited tariff uncertainty as a reason for holding interest rates steady, adopting a “wait-and-see” approach until the full effects of global trade tensions are clearer.
Exchange Rate as Shock Absorber:
The AUD often acts as a buffer during global shocks. If tariffs or trade tensions worsen, a weaker AUD can help offset some of the negative effects by making Australian exports more competitive, but it also increases the cost of imports.
Key Takeaways
Tariff uncertainty has already contributed to recent AUD weakness.
If trade tensions escalate or global growth slows, the AUD could face further downside.
The RBA is likely to remain cautious, and the AUD will remain sensitive to both tariff developments and broader economic data.
#AUDUSD

Bearish drop off 61.8% Fibonacci resistance?The Aussie (AUD/USD) has rejected off the pivot, which acts as a pullback resistance, and could drop to the 1st support, which has been identified as an overlap support.
Pivot: 0.6550
1st Support: 0.6492
1st Resistance: 0.6590
Risk Warning:
Trading Forex and CFDs carries a high level of risk to your capital and you should only trade with money you can afford to lose. Trading Forex and CFDs may not be suitable for all investors, so please ensure that you fully understand the risks involved and seek independent advice if necessary.
Disclaimer:
The above opinions given constitute general market commentary, and do not constitute the opinion or advice of IC Markets or any form of personal or investment advice.
Any opinions, news, research, analyses, prices, other information, or links to third-party sites contained on this website are provided on an "as-is" basis, are intended only to be informative, is not an advice nor a recommendation, nor research, or a record of our trading prices, or an offer of, or solicitation for a transaction in any financial instrument and thus should not be treated as such. The information provided does not involve any specific investment objectives, financial situation and needs of any specific person who may receive it. Please be aware, that past performance is not a reliable indicator of future performance and/or results. Past Performance or Forward-looking scenarios based upon the reasonable beliefs of the third-party provider are not a guarantee of future performance. Actual results may differ materially from those anticipated in forward-looking or past performance statements. IC Markets makes no representation or warranty and assumes no liability as to the accuracy or completeness of the information provided, nor any loss arising from any investment based on a recommendation, forecast or any information supplied by any third-party.

AUDUSD Will Move Lower! Short!
Take a look at our analysis for AUDUSD.
Time Frame: 12h
Current Trend: Bearish
Sentiment: Overbought (based on 7-period RSI)
Forecast: Bearish
The market is on a crucial zone of supply 0.653.
The above-mentioned technicals clearly indicate the dominance of sellers on the market. I recommend shorting the instrument, aiming at 0.649 level.
P.S
Overbought describes a period of time where there has been a significant and consistent upward move in price over a period of time without much pullback.
Disclosure: I am part of Trade Nation's Influencer program and receive a monthly fee for using their TradingView charts in my analysis.
Like and subscribe and comment my ideas if you enjoy them!

Bearish drop?AUD/USD has rejected off the pivot which lines up with the 61.8% Fibonacci retracement and could drop to the 1st support, which is a pullback support.
Pivot: 0.6558
1st Support: 0.6409
1st Resistance: 0.6647
Risk Warning:
Trading Forex and CFDs carries a high level of risk to your capital and you should only trade with money you can afford to lose. Trading Forex and CFDs may not be suitable for all investors, so please ensure that you fully understand the risks involved and seek independent advice if necessary.
Disclaimer:
The above opinions given constitute general market commentary, and do not constitute the opinion or advice of IC Markets or any form of personal or investment advice.
Any opinions, news, research, analyses, prices, other information, or links to third-party sites contained on this website are provided on an "as-is" basis, are intended only to be informative, is not an advice nor a recommendation, nor research, or a record of our trading prices, or an offer of, or solicitation for a transaction in any financial instrument and thus should not be treated as such. The information provided does not involve any specific investment objectives, financial situation and needs of any specific person who may receive it. Please be aware, that past performance is not a reliable indicator of future performance and/or results. Past Performance or Forward-looking scenarios based upon the reasonable beliefs of the third-party provider are not a guarantee of future performance. Actual results may differ materially from those anticipated in forward-looking or past performance statements. IC Markets makes no representation or warranty and assumes no liability as to the accuracy or completeness of the information provided, nor any loss arising from any investment based on a recommendation, forecast or any information supplied by any third-party.

Lingrid | AUDUSD capitalizing on the BULLISH ContinuationOANDA:AUDUSD is forming higher lows above the key ascending trendline, showing clear signs of bullish structure continuation. After breaking out of the flag pattern and triangle, price is now consolidating just above the 0.6572 support zone. If buyers hold this level, a breakout toward the 0.6613 resistance area becomes increasingly likely.
📈 Key Levels
Buy zone: 0.6572–0.6580 (above trendline)
Sell trigger: break below 0.6572 trendline support
Target: 0.6613 resistance area
Buy trigger: bounce from trendline and continuation above minor resistance
💡 Risks
Failure to hold the ascending trendline may trigger deeper correction
Low volume during breakout attempts could invalidate the move
Strong resistance at 0.6613 may cause short-term rejection
If this idea resonates with you or you have your own opinion, traders, hit the comments. I’m excited to read your thoughts!

AUDUSD – The Spring Is Loading!AUDUSD has just pulled off an impressive rebound from the 0.6460 support zone, bouncing cleanly off the ascending trendline — like a compressed spring ready to launch. The repeated appearance of Fair Value Gaps after recent upward moves reveals a critical clue: smart money is stepping back in, and this time, they want control.
The price is now testing the familiar resistance at 0.6616 — a zone that has previously rejected several bullish attempts. But this time feels different. The US dollar is clearly losing steam after softer CPI data, pushing bond yields lower and giving AUD a tactical edge.
If the 0.6520 support holds strong, the next breakout won’t just be about overcoming resistance — it could be the spark for a new bullish wave. And when that wave hits... it won’t go unnoticed.

AUDUSD H4 I Bullish Bounce Off Based on the H4 chart, the price could fall toward our buy entry level at 0.6554, a pullback resistance.
Our take profit is set at 0.6617, aligning with the 127.2% Fib extension.
The stop loss is set at 0.6508, an overlap support.
High Risk Investment Warning
Trading Forex/CFDs on margin carries a high level of risk and may not be suitable for all investors. Leverage can work against you.
Stratos Markets Limited (tradu.com ):
CFDs are complex instruments and come with a high risk of losing money rapidly due to leverage. 63% of retail investor accounts lose money when trading CFDs with this provider. You should consider whether you understand how CFDs work and whether you can afford to take the high risk of losing your money.
Stratos Europe Ltd (tradu.com ):
CFDs are complex instruments and come with a high risk of losing money rapidly due to leverage. 63% of retail investor accounts lose money when trading CFDs with this provider. You should consider whether you understand how CFDs work and whether you can afford to take the high risk of losing your money.
Stratos Global LLC (tradu.com ):
Losses can exceed deposits.
Please be advised that the information presented on TradingView is provided to Tradu (‘Company’, ‘we’) by a third-party provider (‘TFA Global Pte Ltd’). Please be reminded that you are solely responsible for the trading decisions on your account. There is a very high degree of risk involved in trading. Any information and/or content is intended entirely for research, educational and informational purposes only and does not constitute investment or consultation advice or investment strategy. The information is not tailored to the investment needs of any specific person and therefore does not involve a consideration of any of the investment objectives, financial situation or needs of any viewer that may receive it. Kindly also note that past performance is not a reliable indicator of future results. Actual results may differ materially from those anticipated in forward-looking or past performance statements. We assume no liability as to the accuracy or completeness of any of the information and/or content provided herein and the Company cannot be held responsible for any omission, mistake nor for any loss or damage including without limitation to any loss of profit which may arise from reliance on any information supplied by TFA Global Pte Ltd.
The speaker(s) is neither an employee, agent nor representative of Tradu and is therefore acting independently. The opinions given are their own, constitute general market commentary, and do not constitute the opinion or advice of Tradu or any form of personal or investment advice. Tradu neither endorses nor guarantees offerings of third-party speakers, nor is Tradu responsible for the content, veracity or opinions of third-party speakers, presenters or participants.

AUDUSD STARTED FORMING BEARISH TREND STRUCTUREAUDUSD STARTED FORMING BEARISH TREND STRUCTURE
Price started forming lower low, which indicates bearish trend.
price is expected to remain bearish in upcoming trading sessions.
on lower side market may hit the targets of 0.64500 & 0.63800.
On higher side 0.65900 level can act as a important resistance level.

