USDCAD.PRO.OTMS trade ideas

USDCAD INTRADAY range trading capped at 1.4050The USDCAD pair is exhibiting a bearish sentiment, reinforced by the ongoing downtrend. The key trading level to watch is at 1.4060, which represents the current intraday swing low and the falling resistance trendline level.
In the short term, an oversold rally from current levels, followed by a bearish rejection at the 1.4060 resistance, could lead to a downside move targeting support at 1.3780, with further potential declines to 1.3730 and 1.3630 over a longer timeframe.
On the other hand, a confirmed breakout above the 1.4060 resistance level and a daily close above that mark would invalidate the bearish outlook. This scenario could pave the way for a continuation of the rally, aiming to retest the 1.4080 resistance, with a potential extension to 1.4160 levels.
Conclusion:
Currently, the USDCAD sentiment remains bearish, with the 1.4060 level acting as a pivotal resistance. Traders should watch for either a bearish rejection at this level or a breakout and daily close above it to determine the next directional move. Caution is advised until the price action confirms a clear break or rejection.
This communication is for informational purposes only and should not be viewed as any form of recommendation as to a particular course of action or as investment advice. It is not intended as an offer or solicitation for the purchase or sale of any financial instrument or as an official confirmation of any transaction. Opinions, estimates and assumptions expressed herein are made as of the date of this communication and are subject to change without notice. This communication has been prepared based upon information, including market prices, data and other information, believed to be reliable; however, Trade Nation does not warrant its completeness or accuracy. All market prices and market data contained in or attached to this communication are indicative and subject to change without notice.

USD/CAD: Time to Go Long?On the monthly chart, USD/CAD has found strong support, signaling a potential bullish continuation. With anticipated USD strength in the coming weeks, there’s a clear opportunity for the pair to move higher.
We are targeting 1.40180 as the first objective, with the potential to extend towards 1.41500 if momentum continues.
On the daily chart, the price is showing signs of weakness but also bullish intent, suggesting a possible retracement before a move higher. Ideally, a pullback into the 1.38490 – 1.38450 zone would offer a high-probability long entry.


USDCAD SHORT FORECAST Q2 W19 D5 Y25USDCAD SHORT FORECAST Q2 W19 D5 Y25
Professional Risk Managers👋
Welcome back to another FRGNT chart update📈
Diving into some Forex setups using predominantly higher time frame order blocks alongside confirmation breaks of structure.
Let’s see what price action is telling us today!
💡Here are some trade confluences📝
✅Intraday breaks of structure
✅Tokyo ranges to be filled
✅15' order block identified
🔑 Remember, to participate in trading comes always with a degree of risk, therefore as professional risk managers it remains vital that we stick to our risk management plan as well as our trading strategies.
📈The rest, we leave to the balance of probabilities.
💡Fail to plan. Plan to fail.
🏆It has always been that simple.
❤️Good luck with your trading journey, I shall see you at the very top.
🎯Trade consistent, FRGNT X

USDCAD Monthly – Seller Initiative in PlayHey traders and investors!
Take a look at the monthly chart of USDCAD.
The price has been in a sideways range for quite some time, and the seller initiative is currently active.
📌 At the upper boundary of the range, a seller zone (red box) has formed, along with a seller-side Decision bar (IKC), which has now hit the buyer zone (blue box).
⚠️ With this structure, it makes more sense to look for short setups.
This analysis is based on the Initiative Analysis concept (IA).
Wishing you profitable trades!

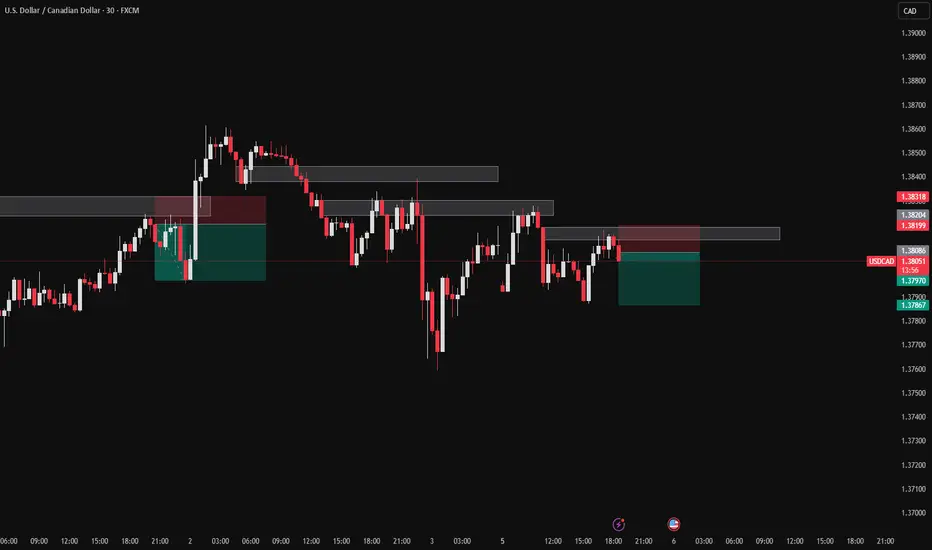
USDCAD massive breakout on Friday? - superswingI´m expecting massive breakout of this pair on Friday due to US (and CAD) NFP. If you decide to trade this pair, you can enter now at current market price 1,38218 or wait for premium-rejection zone at 1,39300-600. Personally I will use the 1. option and average higher if market let me. Use logical size to trade this idea. Every red line is a rejection zone, so TP your trade partially at these line. Do not try to reach the final target with full size. You can consider to trail your profit by moving the SL continuously down when red line is reached. Wish you good luck.

USD/CAD: Ready to Explode from Demand Zone !!Hey guys,
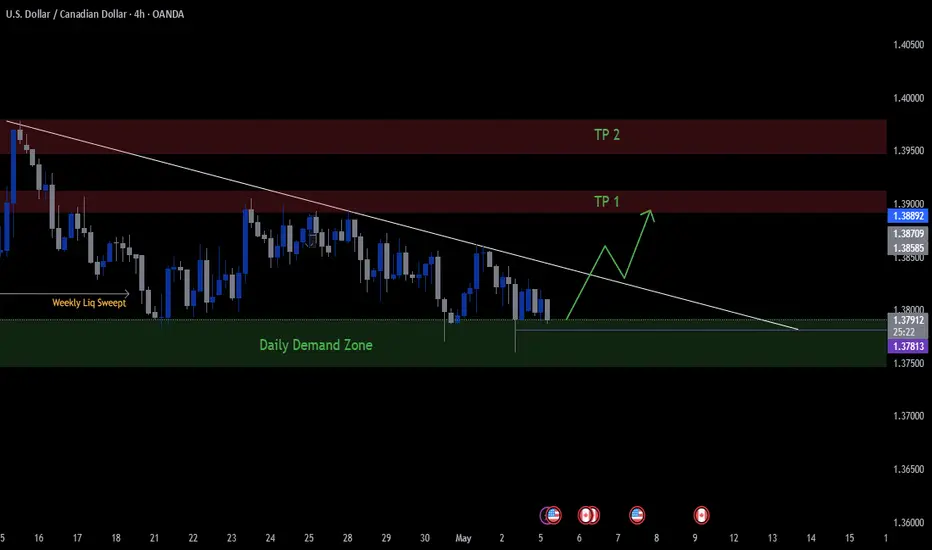
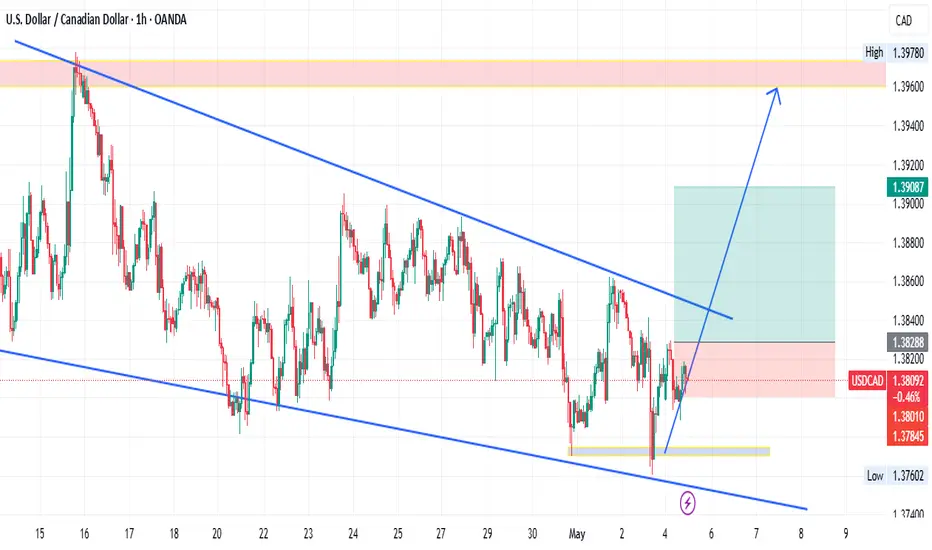
As you can see on the chart, price is sitting on a daily demand zone and has already swept weekly liquidity.
If we get a solid reaction from here, I’m looking at 1.39000 – 1.39500 as the next potential target area.
(Not financial advice)
#USDCAD #Forex #PriceAction #SmartMoney #LiquidityGrab #DemandZone #TechnicalAnalysis #ForexSetups #BreakoutWatch #SwingTrading #ForexTrading #TradingView
USD_CAD WILL GO DOWN|SHORT|
✅USD_CAD is consolidating
Beneath the horizontal resistance
Of 1.3862 so we are bearish
Biased and we will be expecting
A further bearish move down
This trading week
SHORT🔥
✅Like and subscribe to never miss a new idea!✅
Disclosure: I am part of Trade Nation's Influencer program and receive a monthly fee for using their TradingView charts in my analysis.

Canadian Dollar vs US Dollar: Recovering from The Bearish HugsIn previous posts, we have already begun to look at the key factors that have driven the U.S. outperformance over the past decade.
The U.S. market dominance is largely due to the rapid rise of tech giants (such as Apple, Microsoft, Amazon, and Alphabet), which have benefited from strong profit growth, global market reach, and significant investor inflows.
Underperforming Internationally
Markets outside the U.S. have faced challenges such as multiple stifling sanctions and tariffs, slowing economic growth, political uncertainty (especially in Europe), a stronger U.S. dollar, and the decline of high-growth tech sectors.
The Valuation Gap
By 2025, U.S. equities will be considered relatively expensive compared to their international peers, which may offer more attractive valuations in the future.
Recent Shifts (2025 Trend)
Since early 2025, international equities have begun to outperform the S&P 500, and European and Asian equities have regained investor interest. Global market currencies are also heavily dependent on the US dollar.
Factors include optimism around the following three main themes.
DE-DOLLARIZATION. DE-AMERICANIZATION. DIVERSIFICATION.
De-dollarization is the process by which countries reduce their reliance on the US dollar (USD) as the dominant global reserve currency, medium of exchange, and unit of account in international trade and finance. This trend involves a shift away from the centrality of the US dollar in global economic transactions and towards alternative currencies, assets or financial systems.
Reasons for De-dollarization
The move towards de-dollarization is driven by geopolitical and economic factors:
Backlash against US economic hegemony: The US often uses the dollar's dominance to impose sanctions and exert political pressure, encouraging countries to seek financial sovereignty.
Rise of emerging economic powers: Emerging economies such as China and groups such as the BRICS are seeking to reduce their vulnerability to US influence and promote regional integration and alternative financial infrastructures.
Geopolitical tensions: Conflicts such as the war in Ukraine have increased efforts by countries such as Russia to withdraw dollars from their reserves to avoid sanctions.
Summary
De-dollarization is a complex, ongoing process that reflects a gradual shift away from the global dominance of the US dollar. It involves diversifying reserves, using alternative currencies and assets, and creating new financial systems to reduce reliance on the dollar.
Driven by geopolitical tensions and the rise of emerging economic powers, de-dollarization is challenging the entrenched role of the dollar, but is unlikely to completely replace it anytime soon.
Instead, it is leading to a more multi-polar monetary system in international finance, increasing demand for alternative investments in the US.
Technical Test
The main technical chart is presented in a weekly perspective, reflecting the performance of the Canadian dollar against the US dollar FX_IDC:CADUSD over the long term.
With the positive dynamics of the relative strength indicator RSI(14) continuing, a breakout of flat resistance near the level of 0.72 is noted, with the prospect of a possible price increase to 0.80, parity in the currency pair and strengthening of the Canadian dollar to historical maximums, in the horizon of the next five years.
--
Best wishes,
@PandorraResearch Team 😎

USD/CAD 4H CHART PATTERNUSD/CAD Technical Analysis
Chart Pattern: Trend Line Breakout Reversal
Target: 1.44000
1. Overall Market Structure
The chart depicts a clear downtrend, followed by sideways consolidation near a horizontal support line. A descending trend line captures the bearish structure, which has now been challenged by recent bullish momentum.
2. Support Zone & Rejection
The price has respected the support zone multiple times, forming a strong base.
Repeated bounces off this level suggest accumulation, where buyers are building positions.
3. Breakout Confirmation
Price action is attempting to break above the descending trend line, signaling a potential reversal from bearish to bullish.
The "Entry Long" point marks an ideal breakout zone, where traders could enter with confirmation (strong bullish candle close above the trend line).
4. Target Projection: 1.44000
The projected target is 1.44000, aligning with a major resistance level (previous structure highs).
This makes the trade a trend reversal play, aiming to capture the first major upward swing post-breakout .
5. Risk Management
A stop loss should be placed just below the support line or recent swing low to guard against a false breakout.
The trade offers a favorable risk-to-reward ratio, especially if entered on a retest of the breakout zone.

USDCADRange Breakout: The pair has been trading within a range, and the breakout from this range signals potential bullish momentum. A breakout indicates that the price is ready to move out of its consolidation phase, with buyers now in control.
Trendline Breakout: The price breaking above a key trendline further confirms a shift from a bearish or neutral market sentiment to a more bullish one. This is a strong signal that upward momentum is building.

USDCAD I Weekly CLS I KL - Monthly OB I Model 1Hey, Market Warriors, here is another outlook on this instrument
If you’ve been following me, you already know every setup you see is built around a CLS range, a Key Level, Liquidity and a specific execution model.
If you haven't followed me yet, start now.
My trading system is completely mechanical — designed to remove emotions, opinions, and impulsive decisions. No messy diagonal lines. No random drawings. Just clarity, structure, and execution.
🧩 What is CLS?
CLS is real smart money — the combined power of major investment banks and central banks moving over 6.5 trillion dollars a day. Understanding their operations is key to markets.
✅ Understanding the behaviour of CLS allows you to position yourself with the giants during the market manipulations — leading to buying lows and selling highs - cleaner entries, clearer exits, and consistent profits.
🛡️ Models 1 and 2:
From my posts, you can learn two core execution models.
They are the backbone of how I trade and how my students are trained.
📍 Model 1
is right after the manipulation of the CLS candle when CIOD occurs, and we are targeting 50% of the CLS range. H4 CLS ranges supported by HTF go straight to the opposing range.
📍 Model 2
occurs in the specific market sequence when CLS smart money needs to re-accumulate more positions, and we are looking to find a key level around 61.8 fib retracement and target the opposing side of the range.
👍 Hit like if you find this analysis helpful, and don't hesitate to comment with your opinions, charts or any questions.
⚔️ Listen Carefully:
Analysis is not trading. Right now, this platform is full of gurus" trying to sell you dreams based on analysis with arrows while they don't even have the skill to trade themselves.
If you’re ever thinking about buying a Trading Course or Signals from anyone. Always demand a verified track record. It takes less than five minutes to connect 3rd third-party verification tool and link to the widget to his signature.
"Adapt what is useful, reject what is useless, and add what is specifically your own."
— David Perk aka Dave FX Hunter ⚔️

USDCADThis 4-hour chart of USD/CAD presents a bearish channel setup, signaling continuation of the downtrend. Here's a breakdown of the technical context:
Trend & Structure Analysis:
🔻 Descending Channel:
The price is respecting a downward-sloping channel (highlighted in red).
Lower highs are marked by red arrows showing consistent rejection at the upper trendline.
🔹 EMA Resistance:
EMA 9 (blue line) and EMA 21 (orange line) are above price and sloping downward.
The 9 EMA is currently at 1.38199, reinforcing resistance in this area.
🔹 Horizontal Levels:
Daily Resistance around 1.38554 has been rejected repeatedly.
Immediate support lies around 1.37603.
Fibonacci Levels & Bearish Projection:
Fibonacci retracement from a recent swing shows:
0.382 ≈ 1.38241
0.5 ≈ 1.38133 (currently acting as resistance)
Fibonacci Extensions (Downside Targets):
1.618 = 1.36972
2.618 = 1.35951
3.618 = 1.34930
4.236 = 1.34371 (aligns with Daily Demand Zone)
Trade Setup Idea (Short Bias):
Bias: Bearish while price stays below the descending channel’s upper boundary and EMA resistance.
Entry: Near 1.3813–1.3824 (after a potential pullback)
Stop-Loss: Above 1.3855 (daily resistance)
Targets:
TP1: 1.3760
TP2: 1.3697
TP3: 1.3595
TP4: 1.3437 (Daily Demand Zone)

USD-CAD Free Signal! Sell!
Hello,Traders!
USD-CAD is trading in a
Downtrend and the pair is
Consolidating below the
Horizontal resistance
Around 1.3880 so we are
Bearish biased and we can
Enter a short trade on Monday
With the Take Profit of 1.3725
And the Stop Loss of 1.3908
Sell!
Comment and subscribe to help us grow!
Check out other forecasts below too!
Disclosure: I am part of Trade Nation's Influencer program and receive a monthly fee for using their TradingView charts in my analysis.


USDCAD Technical & Order Flow Analysis (Swing Trading)Our analysis is based on multi-timeframe top-down analysis & fundamental analysis.
Based on our view, the price will rise to the monthly level.
DISCLAIMER: This analysis can change anytime without notice and is only for assisting traders in making independent investment decisions. Please note that this is a prediction, and I have no reason to act on it, and neither should you.
Please support our analysis with a like or comment!

USDCAD Buy IdeaUSDCAD is bouncing off a major daily support level around 1.38100 after a strong bearish move. Price action shows early signs of bullish interest, with the potential for a correction toward the 50-day Simple Moving Average. My target is set slightly lower at 1.4142 to ensure profits are secured before major resistance hits.


USDCAD LONG POSSIBILITY SIGNALUnder current market conditions, the area near 1.3821 has been identified as a critical support zone, where the AI model detects a high-probability trade setup.
From a technical perspective, the AI algorithm has recognized a clear directional bias based on recent price action patterns. Suppose the market demonstrates increased volume and price stability above key moving averages in the 1.3821 area. In that case, traders are advised to monitor for trend-continuation entry opportunities in alignment with the prevailing momentum.
Profit targets are defined at 1.3855 and 1.3904, corresponding to logical technical resistance zones. These levels are designed for staged profit-taking across different trade management styles. Stop-loss should be strictly enforced at the designated level; once breached, the strategy is considered invalidated in order to limit potential downside.

USD/CAD at a Turning PointTechnical Analysis: Signs of a Bottoming Out
USD/CAD’s technical picture is beginning to shift from bearish to cautiously bullish. Let’s start with what the daily chart is telling us. Over April, the pair’s decline started to stall around the 1.3780 – 1.3810 zone, which corresponds to a second support level (S2) on pivot point charts. In fact, 1.3780 has been identified by analysts as a “critical support”areaeconomies.com, and the market has thus far respected this floor. For roughly two weeks, prices have been consolidating in a tight range just above this support, roughly between 1.378 and 1.388. This kind of sideways basing after a drop indicates that selling pressure is no longer as aggressive – the CAD hasn’t been able to push the USD convincingly below the support line around 1.38.
Several momentum indicators are aligning to suggest that the worst of the downtrend may be over:
MACD Crossover: The Moving Average Convergence Divergence (MACD) indicator, a favorite tool for gauging trend changes, is on the verge of a bullish crossover (i.e. the MACD line is crossing above the signal line). As of late April, daily MACD had already flipped to a “Buy” readingfortrade.com. A bullish crossover after a prolonged down-move implies the downward momentum is fading and buyers are starting to gain the upper hand. We’re also seeing the MACD histogram (which visualizes the difference between the MACD and its signal) tick up from deeply negative values toward the zero line, reinforcing the idea of a momentum reversal.
RSI Rising from Oversold: The Relative Strength Index (RSI), which measures the speed and change of price movements, dipped into oversold territory during the April sell-off. (Typically, an RSI reading below 30 is considered oversold and a possible sign of an overextended move.) In late April, USD/CAD’s daily RSI was hovering in the low 30sfxstreet.com. Now, in early May, the RSI has climbed upward, moving through the 40s and toward the mid-50s. This upward turn suggests that the prior bearish momentum is abating – in other words, sellers are running out of steam and buyers are gradually stepping in. Notably, the RSI made higher lows even as price made a lower low around 1.378, a classic bullish divergence hinting that the downtrend was losing strength.
Support and Price Action: Price action itself underscores the potential for a bottom. The 1.3800 area (pivot S2)has been tested multiple times and remains intactfxstreet.com. Each dip into the high-1.37s was met with buying interest, as evidenced by candles with lower wicks and quick recoveries back above 1.38. This demand zonearound 1.378–1.381 has effectively absorbed selling pressure. One trader on TradingView noted that “USD/CAD is bouncing off a major daily support level around 1.38100 after a strong bearish move. Price action shows early signs of bullish interest, with the potential for a correction toward the 50-day Simple Moving Average.”tradingview.com. The fact that the pair is holding this support is crucial – it provides a clear line in the sand. As long as 1.3780 holds, the bullish thesis remains alive. A break below that would be a warning sign, but so far the floor has held firm.
Ichimoku Cloud and A Shift in Trend: The daily Ichimoku cloud on the chart (the colored cloud area representing support/resistance and trend) is still positioned above current prices – a legacy of the prior downtrend. However, the pair’s consolidation means it is no longer plunging deeper below the cloud; instead, it’s inching closer to the cloud’s base. Often, when a trend is about to reverse, we see price start testing the underside of the Ichimoku cloud or the baseline (Kijun-sen). While USD/CAD hasn’t broken out above the cloud yet, it’s noteworthy that the cloud ahead is thinning and flattening. A thinner cloud can be easier to break, and a flat Kijun line (baseline) around the 1.40–1.41 area could act like a magnet for price if bullish momentum kicks in. In short, the Ichimoku system is saying the trend is still technically bearish, but conditions are improving for a potential bullish breakif buyers can push the price into the cloud.
Another technical element worth mentioning is the moving averages. During the decline, USD/CAD stayed below short-term moving averages, which acted as resistance. Now we see price testing those moving averages from below. For instance, the 10-day exponential MA and 20-day MA lurk around 1.3870–1.3900 – right where the current consolidation top is. A break above 1.39 would not only clear this minor consolidation range but also put the price back above those moving averages, a bullish sign. Beyond there, the 50-day SMA (around the mid-1.41s) could be an initial target for a rebound. All in all, the technical setup is showing early glimmers of a reversal: a solid support base, momentum indicators flipping positive, and weakening bearish forces. This lays a technical foundation for the argument to go long USD/CAD.
Why This Could Be an Opportunity to Go Long USD/CAD
Bringing together the technical signals and the macro context, the case for a USD/CAD rebound is getting stronger. Here’s a quick recap of why early May 2025 may be an attractive entry point for USD/CAD longs (buying USD against CAD):
Rock-Solid Support: The pair has a concrete floor around 1.3780–1.3800 that has held firmly through multiple tests. This pivot support (S2) level has proven its strengthfxstreet.com, indicating significant buying interest at those lows. A strong support means downside risk can be well-defined (for example, one can place a stop-loss just below it in a trade scenario), and it often serves as a launchpad for rebounds when the broader trend shifts.
Momentum Shift to Bullish: Key momentum indicators are flipping in favor of USD momentum. The MACD on the daily chart has turned upward, signaling waning bearish momentum and a possible bullish crossover – a classic early reversal sign. Likewise, the RSI has risen out of oversold territoryfxstreet.com, showing that the prior selling momentum is exhausted. In fact, a short-term trading model as of Apr 29 showed multiple daily indicators (MACD, RSI, Stochastics) all giving “Buy” signals for USD/CADfortrade.com. When formerly pessimistic indicators start signaling “buy” in unison, it’s often a telltale sign of a trend ready to change direction.
Bullish Price Action Clues: Price is speaking volumes: higher lows are forming on intraday charts and the pair is making attempts to push higher within the recent range. We’ve observed bullish candlestick patterns like small daily dojis and hammers near the lows, reflecting indecision and failed attempts by sellers to break lower. This kind of consolidation after a drop often indicates that the next significant move could be up, especially given the momentum backdrop. Additionally, if USD/CAD breaks above the 1.3900 resistance (which is the upper bound of the consolidation and near the 10-day/20-day moving averagesfxstreet.com), it would mark the first higher-high in weeks – essentially confirming the short-term trend reversal.
USD Fundamentals Support a Rise: The U.S. dollar’s broader fundamentals are relatively robust. The Fed’s higher-for-longer stance (with only modest rate cuts expected later) keeps USD interest rates attractiveam.jpmorgan.com, and the U.S. economy has been outperforming many peers in growth, which has underpinned the USD’s strengtham.jpmorgan.com. This means any USD weakness narrative might have been overdone – if traders realize the Fed won’t ease as much as hoped, USD could get a second wind. A stable or rising USD on the global stage directly benefits a long USD/CAD position.
Canadian Headwinds (Oil & Risk): The Canadian dollar, in contrast, faces a few headwinds. Commodity support is lacking – with oil prices recently in the doldrums at 4-year lows around $58investingnews.com, a key pillar of CAD strength has crumbled. Unless oil stages a dramatic comeback (which is not expected immediately, given only a moderate rebound to ~$68–$74 forecasted by the EIAinvestingnews.com), the CAD could struggle to maintain its recent strength. On top of that, if global risk appetite wavers, traders could rotate out of risk-sensitive currencies like CAD into safer havens. In short, the CAD may have enjoyed a good run, but the tables appear set to turn in favor of the USD.
Attractive Risk/Reward Setup: From a trading perspective, going long USD/CAD near current levels offers a compelling risk-to-reward scenario. The support at ~1.3780 provides a logical and tight risk cutoff – if the pair falls decisively below that, one can admit the bullish thesis was premature and exit. On the upside, even a retracement to mid-range resistance levels like 1.4000–1.4100 (around the 50-day MA or pivot resistance) would yield a solid gain relative to the risk. The trader who shared the long idea on USD/CAD set a target around 1.4140, just shy of major resistance, highlighting the potential for a move of several hundred pips off the lows if the reversal takes holdtradingview.com. The combination of well-defined support, improving indicators, and room overhead for a bounce means the odds are tilted that a long position could be rewarded.
Of course, no trade or investment is guaranteed – and one must always stay vigilant. If USD/CAD were to close below ~1.3780 support, it would call into question the bullish setup and could open the door to further downside (perhaps another leg down to the mid-1.37 or even low 1.36 area in a bearish scenario). But as things stand, the evidence leans bullish, and the reward potential outweighs the remaining downside risk, in our view.
