USDCAD Update:
USDCAD Update:
Initially, I expected USDCAD to reach its weekly historical high, but it reversed instead. This setback is normal.
Key points:
- Draw on liquidity is the weekly order block
- No fear, all losses will be recovered
USDCAD trade ideas


Thu 26th Dec 2024 USD/CAD Daily Forex Chart Sell SetupGood morning fellow traders. On my Daily Forex charts using the High Probability & Divergence trading methods from my books, I have identified a new trade setup this morning. As usual, you can read my notes on the chart for my thoughts on this setup. The trade being a USD/CAD Sell. Enjoy the day all. Cheers. Jim

USD/CAD First Yearly Close > 1.4000 Since 2002It was a blistering Q4 for the US Dollar and that's especially true in USD/CAD. While USD reversed aggressive at the Q4 open while getting a shot-in-the-arm around the U.S. Presidential election, in USD/CAD there was also the added drive of tariff potential after President-elect Trump threated a 25% tariff on Canadian goods unless the border was shored up. That comment came on November 26th and led to a bullish spike in the pair, which did recede; but after that the 1.4000 level began to show as support and buyers pushed another strong move through December trade. There were especially noticeable drives on both the NFP report and the FOMC rate decision.
After the Trump comment re: 25% tariffs on Canada, PM Trudeau flew down to Florida to try to appeal to Trump. Trump's response after seems jovial in nature, as he called Canada the 51st U.S. state and PM Trudeau a 'governor.'
I think the big question here is whether Trump wants a strong U.S. Dollar which a push towards austerity could produce. And if that happens, weakness could show in equities which could then bring questions around his economic agenda.
I'm expecting something similar to what showed in 2017, when shortly after inauguration Trump opined that the U.S. Dollar was 'too strong,' after which the currency went into a tailspin for the rest of the year, even as the Fed hiked rates three times in 2017 and four times in 2018.
If we do see mean reversion in the US Dollar, USD/CAD could remain attractive for similar themes. For now bulls are still pushing and next resistance is the same 1.4690 area that was respected back in early-2016 and again in 2020. - js

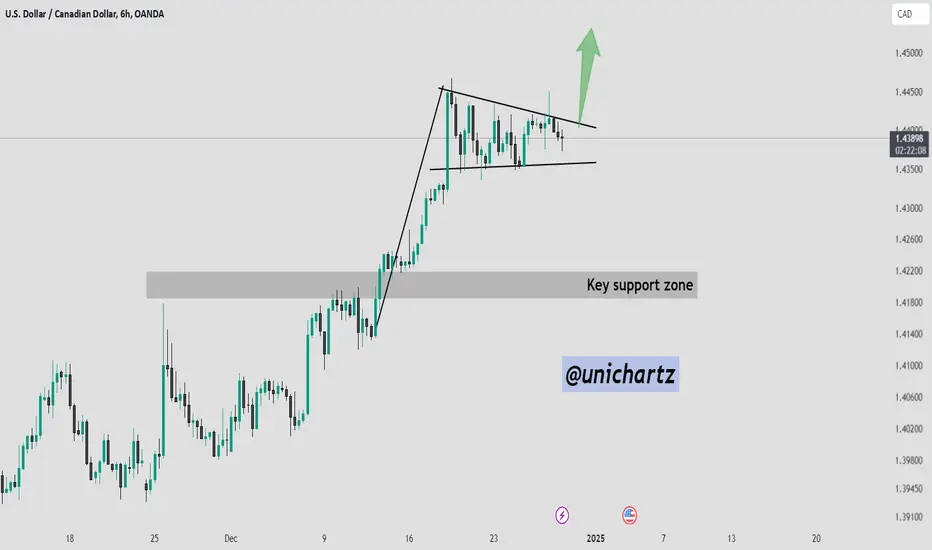
USD/CAD Bull Flag: Is 1.4500 the Next Stop?The USD/CAD 6-hour chart shows a bull flag pattern, a continuation setup that typically signals the resumption of the prior bullish trend.
Following a strong upward rally, the price has consolidated in a downward-sloping channel, characteristic of a bull flag.
A breakout above the resistance (~1.4410) would confirm the pattern, potentially driving the price higher toward the next target of 1.4500 or beyond.


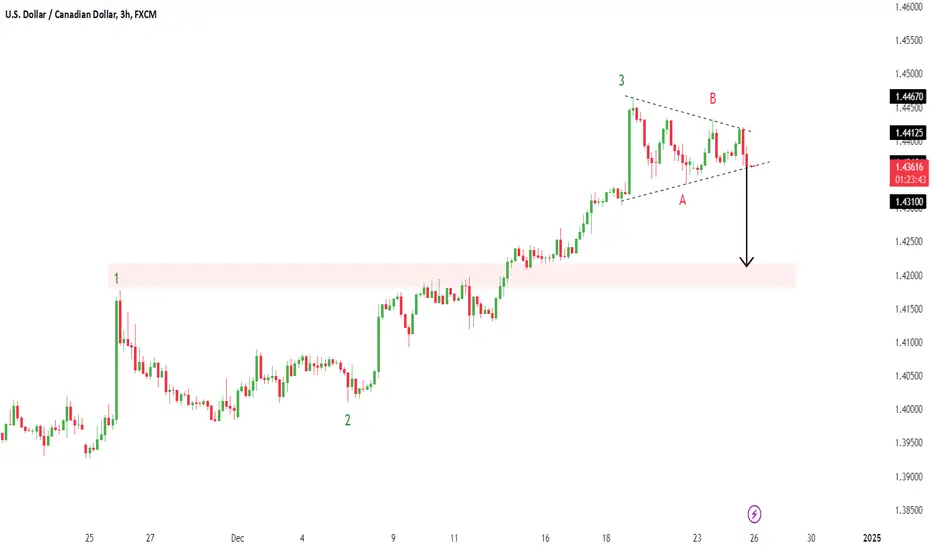
Could the price bounce from here?USD/CAD is falling towards the support level which is a pullback support that aligns with the 61.8% Fibonacci retracement and could bounce from this level to our take profit.
Entry: 1.4038
Why we like it:
There is a pullback support level that lines up with the 61.8% Fibonacci retracement.
Stop loss: 1.4348
Why we like it:
There is a pullback support level that lines up with the 138.2% Fibonacci extension.
Take profit: 1.4436
Why we like it:
There is a pullback resistance.
Enjoying your TradingView experience? Review us!
Please be advised that the information presented on TradingView is provided to Vantage (‘Vantage Global Limited’, ‘we’) by a third-party provider (‘Everest Fortune Group’). Please be reminded that you are solely responsible for the trading decisions on your account. There is a very high degree of risk involved in trading. Any information and/or content is intended entirely for research, educational and informational purposes only and does not constitute investment or consultation advice or investment strategy. The information is not tailored to the investment needs of any specific person and therefore does not involve a consideration of any of the investment objectives, financial situation or needs of any viewer that may receive it. Kindly also note that past performance is not a reliable indicator of future results. Actual results may differ materially from those anticipated in forward-looking or past performance statements. We assume no liability as to the accuracy or completeness of any of the information and/or content provided herein and the Company cannot be held responsible for any omission, mistake nor for any loss or damage including without limitation to any loss of profit which may arise from reliance on any information supplied by Everest Fortune Group.


EURUSD & USDCAD TECHNICAL ANALYSISFrom the weekly starting point, this is the top-down analysis on EURUSD and USDCAD Looking from the last cot report that was released, we saw the non-commercials heavily net short on the Canadian dollar, which is the catalyst for the big buy we saw on USDCAD, and the net short on the EURO dollar, which is also the catalyst for the huge sell-off of EURUSD. the live stream explains further details on technical analysis...

Short Buying The USD/CAD trading chart is showing an upward trajectory, presenting a favorable setup for short-term buyers. The price action suggests bullish momentum, potentially driven by positive market sentiment or economic indicators. Traders might consider entering buy positions while closely monitoring resistance levels and market news for any potential reversals. Risk management strategies, such as stop-loss orders, are recommended to mitigate any unexpected market shifts. Keep an eye on key levels to lock in profits effectively.


Lingrid | USDCAD selling OPPORTUNITY in the Sideways MARKETFX:USDCAD is currently moving sideways after a bullish trend that began in September. It has encountered a strong resistance zone that was established in March 2020. Therefore it’s possible that the price may consolidate for an extended period following such a strong upward move. At present, price action is trading within the range established in the previous week. The price is forming a clear range, consistently bouncing between the top and bottom levels. I expect the market to continue consolidating, providing opportunities to capitalize on the sideways movement. My goal is support zone around 1.43730
Traders, if you liked this idea or if you have your own opinion about it, write in the comments. I will be glad 👩💻

USDCAD aNALYSISIf you're considering shorting USDCAD (betting that the price will decrease) today, here are some general strategies and market factors to keep in mind:
### 1. **Trend Analysis:**
- **Technical Indicators:** Shorting is often more favorable when the price is showing signs of being overbought or nearing resistance levels. Look for bearish signals like a downtrend, overbought conditions on the RSI (Relative Strength Index), or price rejection at a key resistance zone.
- **Moving Averages:** A shorter-term moving average crossing below a longer-term moving average (like the 50-period crossing below the 200-period) can indicate a potential downward trend. If USDCAD is showing a crossover in this manner, it could support shorting decisions.
### 2. **Fundamental Drivers:**
- **Oil Prices:** Canada is a major oil exporter, so USDCAD often moves in correlation with oil price fluctuations. If oil prices are falling, the Canadian dollar (CAD) typically weakens. A drop in oil prices might suggest a weakening CAD, which could lead to a USDCAD move higher.
- **Economic Data Releases:** Economic reports such as GDP, inflation, or employment numbers can impact the pair. If there’s any negative news coming from Canada or better-than-expected data from the U.S., it could strengthen the USD relative to CAD and potentially make a short position on USDCAD more appealing.
- **Central Bank Policies:** Pay attention to the Federal Reserve (Fed) and Bank of Canada (BoC) policy announcements. Any hawkish stance by the Fed or dovish stance by the BoC would typically lead to USD strength and potential for USDCAD shorts.
### 3. **Key Levels:**
- **Support and Resistance:** Analyze key support and resistance levels on the daily or 4-hour charts. If USDCAD has been unable to break a significant resistance level (for example, near 1.3700), it could indicate an opportunity to short if the price starts to reverse from that point.
- **Pivot Points:** These can also provide insights into potential turning points. If USDCAD is approaching or struggling to break through a key pivot point, it may present a short opportunity.
### 4. **Risk Management:**
- Always have a clear stop loss in place to limit potential losses if the market moves against your position.
- Use proper position sizing to ensure that a single trade doesn’t overly affect your overall capital, especially with volatile pairs like USDCAD.
### 5. **Short-Term Catalysts:**
- Keep an eye on news releases, such as the U.S. Federal Reserve speeches, important economic data like U.S. job numbers, or statements from the Bank of Canada. Any surprise in these areas could fuel short-term moves in USDCAD.
In summary, a potential USDCAD short today would depend on technical confirmation (overbought conditions, resistance), fundamental factors like oil prices, and key news events. The best practice is to ensure that the market sentiment aligns with your position, and use risk management tools to minimize exposure in case of an adverse move.

Bullish Outlook for USDCAD: Strategic Entry Ahead!As we look at the USDCAD currency pair, the signals from our EASY Trading AI strategy clearly indicate a bullish trend. The current analysis suggests an optimal entry price at 1.43998, with a solid take profit target set at 1.44355667 and a stop loss strategically placed at 1.43488667.
Several factors contribute to this optimistic forecast. Firstly, recent economic data out of Canada shows positive trends in employment and manufacturing, reinforcing the strength of the Canadian dollar. At the same time, ongoing geopolitical tensions and a dovish stance from the US Federal Reserve support the U.S. dollar's vulnerability, tilting the balance in favor of CAD.
Moreover, our automated trading signals from the EASY Trading AI have demonstrated a high accuracy rate, particularly on the USDCAD pair, with backtesting results highlighting a robust win ratio. The current market sentiment reflects increasing bullish momentum, further validating our buying stance.
To maximize your trading success, it's essential to monitor the market closely and be ready to adapt as new data emerges. Don't forget to leverage the free signals available through our Telegram bots, which provide real-time updates to ensure you stay ahead of market developments.
In conclusion, the USDCAD pair presents a compelling buying opportunity based on comprehensive analysis and market conditions. Happy trading!


USDCAD Analysis: Bullish MomentumThe USDCAD pair has been extremely bullish lately, which is why it caught my attention. We can see multiple breaks to the upside, indicating a strong trend. Despite expecting a potential pullback in the near term, the overall trend remains very strong. This is why I have entered a position on the 1-hour timeframe.
Using the WiseOwl Indicator, we can see that it has been capitalizing on the trend with previous wins of +3.96RR, +7RR, and +5.42RR. Currently, we are in a risk-free trade with the stop loss set at breakeven (BE).
The EMAs (20, 50, 100, 200) are all aligned to support the bullish trend. Let's see how this plays out! 💪


USDCAD: Triangle Formation Poised for a BreakoutUSDCAD appears to be consolidating in the form of a triangle pattern. Based on my wave count, the pair is currently completing Wave D within the structure. And, after Wave E concludes and there is a confirmed break above Wave B, I anticipate further upward movement.
Triangles often signal a pause in the market before a continuation of the prevailing trend. In this case, the bullish breakout scenario aligns with the broader market dynamics.
Should monitor the completion of Wave E and watch for a decisive breakout above the resistance formed by Wave B, as this will confirm the upward trajectory and provide an opportunity for long positions.

USDCAD LONG TERM VIEWIf the price has to reverse then it should reverse from the point where it is currently trading (1.3628), beyond this point price will move to 1.3794 from where it can reverse back to 1.3380 which could be strong support for the huge rally that could lead to break the last high of 1.4677 and can set a new record high. The dotted red lines indicates the possible resistance points. The solid red line is the strong resistance line, above that point will open the way up to 1.3988 and beyond.