USDCAD TRADE SETUPWait for retest the entry level then take a trade for Sell otherwise skip this setup
USDCAD trade ideas

USDCAD Trendline Breakout Ready for a Long SellHello Traders
In This Chart EURUSD HOURLY Forex Forecast By FOREX PLANET
today EURUSD analysis 👆
🟢This Chart includes_ (EURUSD market update)
🟢What is The Next Opportunity on EURUSD Market
🟢how to Enter to the Valid Entry With Assurance Profit
This CHART is For Trader's that Want to Improve Their Technical Analysis Skills and Their Trading By Understanding How To Analyze The Market Using Multiple Timeframes and Understanding The Bigger Picture on the Charts

USDCAD DUE FOR RELIEF THIS WEEKUSDCAD is approaching major weekly support after the multiple weeks of a sell of off; in line with a .618 fibronacci retracement. Although as price rest on this level of demand, it will need a few days to mature.
-On the daily time frame we see an overextension to the downside as the RSI nears 30 with levels in line with weekly as well.
-Personally I'll be waiting for price to mature on the 4hr timeframe to take entry on some buys.
-

USDCAD is Likely to Test the Channel Support of 1.37 ?Last Friday, USDCAD broke through the support of the downward trend channel, which has now turned into resistance. It is currently situated in a strong support zone and may experience a pullback, encountering resistance. It is likely to return to the robust channel support at 1.37. Let's observe what happens.


USD-CAD Swing Long! Buy!
Hello,Traders!
USD-CAD fell sharply to
Retest a horizontal support
Level of 1.3855 and as it is
A strong horizontal demand
Are we will be expecting a
Bullish correction on Monday
Buy!
Comment and subscribe to help us grow!
Check out other forecasts below too!
Disclosure: I am part of Trade Nation's Influencer program and receive a monthly fee for using their TradingView charts in my analysis.

Short term buy/Long term sellLook8ng at the daily chart, price earlier created break of structure and pushed up to fill liquidity, which triggered sell afterwards based on the BOS.
Looking at the USD DXY formation, it's time to buy short term as price hit demand zone on daily.
Current demand zone would not hold much after a medium term because of equal low liquidity printed previously by the demand zone.
Sometime in the week, price will trigger new bearish move which is bound to create a long term sell again breaking below previous demand zone to a new low.


WHY USDCAD IS DROPPING ?? DETAILED ANALYSISUSDCAD is currently reacting from a strong daily supply zone after a sustained upside move, and we are now seeing clear signs of bearish structure forming. Price has broken through multiple short-term supports and is now trading around the 1.38600 level, sitting right above a key demand zone that held in late 2023. Given the aggressive sell-off and rejection from the 1.43400–1.44500 resistance range, the market appears to be preparing for a deeper retracement. My bearish target is 1.34600, which aligns with the previous major demand level and psychological support.
Technically, the chart shows two strong bearish engulfing moves from supply, followed by lower highs and lower lows. This shift in structure combined with repeated rejections from resistance zones indicates the momentum is shifting in favor of sellers. If the current zone fails to hold on the retest bounce, we could see a strong continuation leg down. I expect a minor correction toward 1.41600 before further downside resumes, offering an ideal risk-reward short setup for swing traders.
From a fundamental perspective, the Canadian Dollar remains firm, supported by strong crude oil prices as WTI holds above $85 amid geopolitical tensions and production cuts. At the same time, recent U.S. data has shown mixed signals, with sticky inflation keeping the Fed cautious, but slowing job growth and consumer spending raising concerns. If oil prices remain elevated and Fed rate cut expectations increase later this quarter, the USDCAD pair is likely to stay under pressure.
With CAD strength driven by energy markets and the USD facing headwinds from softening macro indicators, this setup aligns both technically and fundamentally for a bearish continuation. I’ll be watching for clean rejections from the 1.40000–1.41600 resistance zone before loading more shorts toward 1.34600. Patience is key — this could be a high-probability move in the coming weeks.


USDCAD Wave Analysis – 11 April 2025- USDCAD broke support zone
- Likely to fall to support level 1.3800
USDCAD currency pair recently broke the support zone between the support level 1.4040 (which reversed the price sharply at the start of April, as can be seen below), 50% Fibonacci correction of the upward price move from September and the support trendline of the daily down channel from March.
The breakout of this support zone accelerated the active short-term impulse wave 3 – which belongs to intermediate impulse wave (C) from February.
USDCAD currency pair can be expected to fall to the next support level 1.3800, former monthly low from November.


#USDCAD: We took the Swing Sell, Now let's focus on Swing Buy! The USD/CAD exchange rate experienced a significant decline, reaching its all-time high against the USD. This decline is primarily attributed to the ongoing trade dispute between China and the United States, which has led to a depreciation of the USD and resulted in a yearly low.
However, we anticipate a potential reversal in the price trajectory. We identify a favourable area where the price may stabilise and address the liquidity gap it has created.
We have established three targets, and to effectively utilise these targets, we recommend executing small entries with each target set based on a predetermined take-profit level.
We extend our sincere gratitude for your unwavering support throughout this journey within this community. Additionally, we appreciate the contributions of each individual who has supported our endeavours. We are pleased to announce that we have garnered 20,000 followers.
Much Love,
Team Setupsfx_
❤️🚀


#USDCAD: Two Big Target Accumulating of 800+ Pips! **USDCAD **
Following the US President’s decision to impose a 25% tariff rate on Canada, the USD/CAD exchange rate experienced a significant surge, reaching approximately 1.49. However, as the market has stabilised, we anticipate a gradual decline in the exchange rate, which may help bridge the liquidity gap.
Two prominent red lines serve as potential entry and stop-loss points. Additionally, two designated targets are set as swing take-profit areas.
We appreciate your unwavering support. Should you have any inquiries regarding the strategy or any trading-related questions, please do not hesitate to provide feedback.
Team Setupsfx_

Weekly Buy Trade Plan – USD/CAD (April 2025)This is a weekly timeframe bullish setup on USD/CAD, focusing on a high-probability buy opportunity based on key support structure and RSI dynamics.
🧠 Technical Outlook:
Price has strongly rejected a major historical support zone around 1.37781 – 1.38800, highlighted by the green horizontal line.
This level has acted as strong support multiple times in the past, making it a key demand zone for potential reversal.
After a strong bearish leg, the current price action suggests exhaustion in selling pressure, indicating a likely bounce from this level.
💹 Why Long?
Price is sitting right above the support zone, with buyers stepping in around the 1.38800 level.
This area aligns with previous structure and is a likely zone where institutional buyers may accumulate.
📊 RSI Analysis:
RSI (14) is at 39.99, entering the oversold territory and showing early signs of potential reversal.
Although momentum is still bearish, this is where contrarian entries often occur—anticipating a bounce back toward midline (50+) or higher.
✅ Trade Setup Details:
Entry: Around 1.38800 zone (current support zone)
Stop Loss: Below 1.37781 (to protect against deeper correction)
Take Profit: Targeting the 1.42000 – 1.43000 resistance zone
Risk-Reward Ratio: Around 1:2.5 or better, offering a solid return potential if price rebounds
⚠️ Trade Management Tips:
Watch for bullish confirmation candles on the daily or H4 for added confluence.
Monitor USD and CAD fundamentals for short-term volatility (e.g., interest rate decisions, oil prices).
Secure partial profits near 1.41000 and trail your stop.

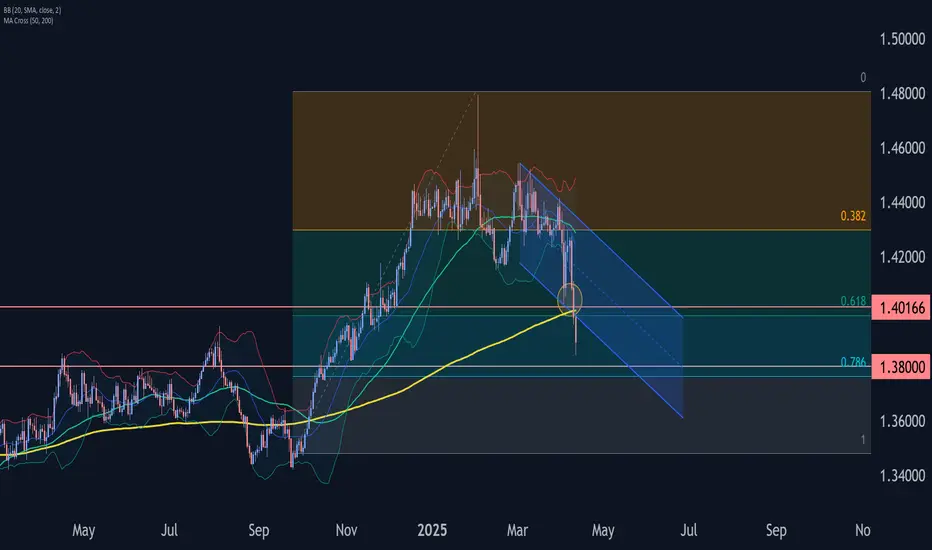
USDCAD - Long-Term Long!Hello TradingView Family / Fellow Traders. This is Richard, also known as theSignalyst.
📈USDCAD has been overall bullish from a macro perspective trading within the rising blue channel.
This week, USDCAD has been in a correction phase trading within the falling red channel.
Moreover, the green zone is a strong resistance turned support.
🏹 Thus, the highlighted blue circle is a strong area to look for buy setups as it is the intersection of support and lower red/blue trendlines acting non-horizontal support.
📚 As per my trading style:
As #USDCAD approaches the blue circle zone, I will be looking for bullish reversal setups (like a double bottom pattern, trendline break , and so on...)
📚 Always follow your trading plan regarding entry, risk management, and trade management.
Good luck!
All Strategies Are Good; If Managed Properly!
~Rich
Disclosure: I am part of Trade Nation's Influencer program and receive a monthly fee for using their TradingView charts in my analysis.

USD/CAD 1H – Bearish Setup with SBR & DBD Zone | Trendline BreakKey Zones:
🔵 Entry Point (Sell):
Around 1.41300–1.41500 (Supply Zone: SBR + DBD zone)
Price is expected to pull back here before dropping
This is the ideal place to look for bearish confirmation
🟦 Supply Zone (Resistance)
🔴 Stop Loss:
Just above 1.41804
If price hits this, the bearish idea is invalidated
⚠️ Protection zone
🟡 Demand Zone (Support):
1.40000–1.40500
Price may bounce here temporarily
Watch for consolidation or breakout
🟢 Take Profit / Target Point:
1.39320
This is the final target for the short position
Potential -1.36% move / 192.7 pips
💰 Profit zone
Visual Summary with Dots:
🔵 Sell Entry: Around 1.41400
🔴 Stop Loss: Above 1.41800
🟢 Take Profit: At 1.39320

Short trade
Day TF overview
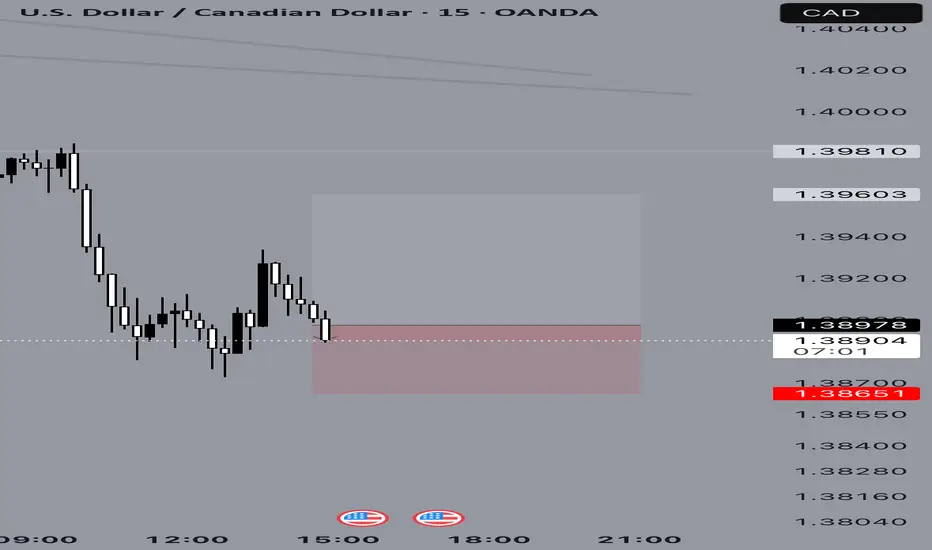
📉 Trade Breakdown – Sell-Side (USDCAD)
📅 Date: Thursday, April 10, 2025
⏰ Time: 10:30 AM (New York Time) – NY Session AM
📈 Pair: USDCAD
📉 Trade Direction: Short (Sell)
Trade Parameters:
Entry: 1.40162
Take Profit (TP): 1.39390 (–0.55%)
Stop Loss (SL): 1.40307 (+0.10%)
Risk-Reward Ratio (RR): 5.32 ✅
Reson: Try to attempt the NY reversal narrative assuming bearish sentiment
30min TF overview
