USDCAD LONGThis chart is of USDCAD is printing a Bullish trend as the trend line is showing falling edge.
USDCAD_LMAX trade ideas

Long Buddy!!!My macd strategy has triggered. I’m long and 1.375 is my first target area by week’s end.
Trade safely my friends
What do you think?

Bullish bounce off 61.8% Fibonacci support?USD/CAD has made a bullish reaction off the pivot and could potentially bounce higher towards the 1st resistance.
Pivot: 1.3668
1st Support: 1.3628
1st Resistance: 1.3738
Risk Warning:
Trading Forex and CFDs carries a high level of risk to your capital and you should only trade with money you can afford to lose. Trading Forex and CFDs may not be suitable for all investors, so please ensure that you fully understand the risks involved and seek independent advice if necessary.
Disclaimer:
The above opinions given constitute general market commentary, and do not constitute the opinion or advice of IC Markets or any form of personal or investment advice.
Any opinions, news, research, analyses, prices, other information, or links to third-party sites contained on this website are provided on an "as-is" basis, are intended only to be informative, is not an advice nor a recommendation, nor research, or a record of our trading prices, or an offer of, or solicitation for a transaction in any financial instrument and thus should not be treated as such. The information provided does not involve any specific investment objectives, financial situation and needs of any specific person who may receive it. Please be aware, that past performance is not a reliable indicator of future performance and/or results. Past Performance or Forward-looking scenarios based upon the reasonable beliefs of the third-party provider are not a guarantee of future performance. Actual results may differ materially from those anticipated in forward-looking or past performance statements. IC Markets makes no representation or warranty and assumes no liability as to the accuracy or completeness of the information provided, nor any loss arising from any investment based on a recommendation, forecast or any information supplied by any third-party.

USDCAD: Pullback From Support 🇺🇸🇨🇦
USDCAD tested an intraday horizontal support.
After its test, the price formed an inverted h&s pattern
on an hourly time frame, and broke its neckline.
We can expect a pullback now, at least to 1.36845
❤️Please, support my work with like, thank you!❤️

Strifor || USDCAD-17/04/2024Preferred direction: SELL
Comment: For this currency pair, we continue to follow the medium-term sales, despite the fact that the price has risen a little more than we described in previous trading ideas. Today, the current levels are excellent for medium-term short with a target at the level of 1.37020 ( scenario №1 ), where the previous area of accumulation of the limit buyer is located. We also keep alternative scenario №2 ready for the same target as with scenario №1 .
Additional comments on this trade will be provided as situation changes. Follow us!
Thank you for like and share your views!

USDCAD TREND-FOLLOWING Hello Traders and everyone, I am Hadi Karaali, Known as SNIPERS_FX
If you like the idea, do not forget to support with a like and follow.
USDCAD TREND-FOLLOWING. 📚
👉As we can see price is still overall bullish from a long-term perspective, trading inside this rising channel.
👉 And price recently rejected clearly our upper resistance zone, and our correction started, Moreover, we are interested in looking for new impulse as we are still overall bullish.
👉As per my trading plan, I will be waiting for the price to be approaching my marked support zone, lining up with our rising trendline, then I will be zooming into lower time frame to be looking for any bullish reversal pattern, catching the next impulse wave.
If you like this kind of analysis don't forget to like and follow
and as usual follow your trading plan and manage your risk.
Be patient and good luck!

USDCAD 1H Intraday Bullish: As long as (1.36540) is support look for Long position above 1.36540 target 🎯 at 1.36900

USDCAD | LT Short D1 | Oil to power CAD StrengthPair: FX:USDCAD
Timeframe: D1 - Long Term (LT)
Direction: Short
Technical Confluences for Trade:
- Stochastics are in Overbought Conditions on D1, H4 and H1 time-frames
- Price action is at the top-end resistance of a parallel channel
- Horizontal trendline looks like a supply zone across few periods
- Aiming for the 32.8% Fibo Retracement with 23.6% as the TP 1 level
Fundamental Confluences for Trade:
- A strong oil story from ongoing geopolitical risks is a strong story for CAD's economy to remain their hold on interest rates while US's reflation story has been priced in by markets
- Risk is further war escalation from the Israel-Iran tension which continue the rush to safe-havens like USD or JPY.
Suggested Trade:
Entry @ Area of Interest 1.3750 - 1.3850
SL @ 1.3898
TP 1 @ 1.3640 (TP Half-Position & move SL to Entry level for B/Even once TP1 is achieved)
TP 2 @ 1.3567
Risk-to-Reward @ Approx. 2.08 (Depending on Entry Level)
May the pips move in our favor! Good luck! :D
*This trade suggestion is provided on an advisory basis. Any trade decisions made based on this suggestion is a personal decision and am not responsible for any losses derived from it.

USDCAD bearish continues Previous support 1.37 now becomes resistance
we look to sell there 1.37 zone
Further downside is expected
The RSI is trending lower
Profit level is previous resistance 1.36
Tp 2: safe profit 1.365

check the trend According to the behavior of the price in the current support range, possible scenarios have been identified.
Considering that the corrective pattern has not been completed, the possibility of starting an upward trend is low

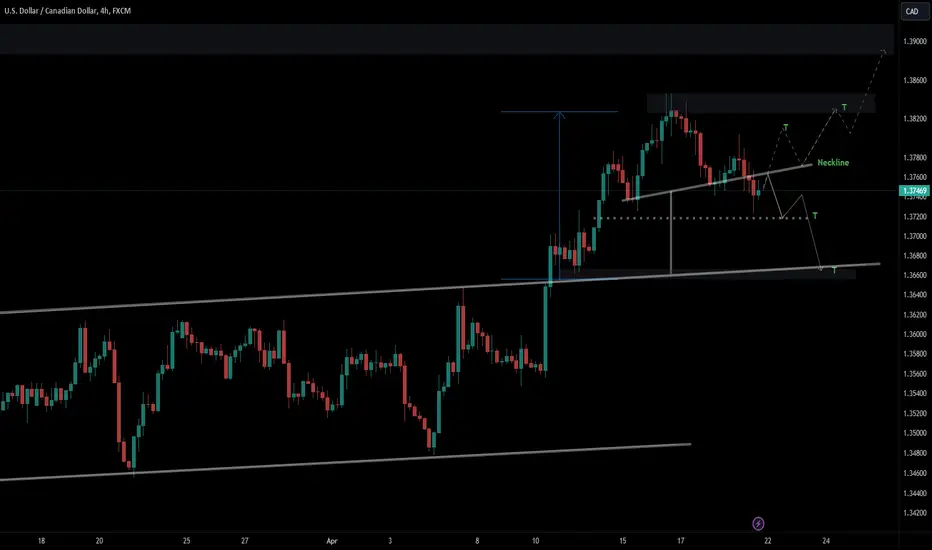
USDCAD - ITDWith Price objective for Ascending channel achieved (previous post), in an uptrend and pair not far from major resistance, suddenly a potential H & S pattern is up with price objective (deep retracement to the upper channel trend line). In addition somewhat like a double bottom continuation too. Well could be a tricky one so I have 2 scenarios lined up. Price and neckline will be decisive factors here. So wont jump into quick conclusion. I wait for further play from price to follow.
*IntraDay - ITD
Target - T
Sell USDCAD Head & Shoulder PatternUSD/CAD H1 Chart - Potential Short Entry Based on Head and Shoulders Pattern
The USD/CAD H1 chart might be presenting a shorting opportunity based on a possible Head and Shoulders pattern.
Pattern: Head and Shoulders (Bearish Reversal)
Description:
This pattern consists of three peaks: a left shoulder, a higher middle peak (head), and a right shoulder that is lower than the head.
A neckline is drawn connecting the swing lows before the left shoulder and the right shoulder.
If the price dips below the neckline (support level), it could signal a potential sell entry.
Profit Targets: Potential profit targets can be based on the height of the head (measured from the head to the neckline) projected downwards from the breakdown point. Technical indicators can also be used for profit targets.
Thank you.

USDCAD ShortUC is on the brink of breaking through the support line amid massive divergence.
OANDA:USDCAD

USDCAD - Head and Shoulders 📉Hi Traders !
On Tuesday 16 April, The USDCAD Reached The Resistance Level (1.38088 - 1.38549).
The Price Formed a Head and Shoulders Pattern.
Currently, The Neckline is Broken !
So, I Predict a Bearish Move 📉
TARGET: 1.36300🎯

USDCAD - 4hrs ( Sell Trade Target Range 240 PIP ) Pair Name : USD/CAD
🗨Time Frame : 4hrs Chart / Close
➕Scale Type : Large Scale
------
🗒 spreading knowledge among us and to clarify the most important points of entry, exit and entry with more than 5 reasons
We seek to spread understanding rather than make money
✔️ Key Technical / Direction ( Short )
Type : Mid Term Swing
———————————
Bearish Break
1.37250 Area
Reasons
- Major Turn level
- Patter Break
- Choch area
- Fixed Range poc
- day + week Low Area
Bullish Reversal
1.35200 Area
Reasons
- Major Turn level
- Pattern Target
- channel Lower Band
- Choch
- Fibo Golden
- Visible Hvn

USD/CADUSD/cad bullish? We see. Break and retest on 1 hour time frame rsi at the the bottom of the support line on it what do you guys think?

USDCAD on 2 Hour:Potential reversal pattern forming, after price rejected off the higher timeframe resistance zone (Weekly).
To confirm this pattern as valid, I would first like to see a shift in structure (A breakout of the previous higher low) then wait for price to retest structure as new resistance, showing a shift to a downside towards the 2 zones below to complete the pattern.

WOHOO USD Is MELTING So As My USDCAD Tradethe price is standing at a strong area of resistance since Oct 2022 this area pushes the price each time very strongly. the second entry reason is that the price created this reversal head and shoulders pattern so we can enter a sell trade directly around the neckline.
The price melted from the neckline after closing below it and my trade is in 70 Pips now !!
Congratulations if u entered with me

USDCAD: Will Start Growing! Here is Why:
Balance of buyers and sellers on the USDCAD pair, that is best felt when all the timeframes are analyzed properly is shifting in favor of the buyers, therefore is it only natural that we go long on the pair.
❤️ Please, support our work with like & comment! ❤️

USDCADThe USDCAD pair has encountered a resistance zone and has subsequently retraced, forming a bearish head and shoulders pattern. This could potentially lead to a downward movement towards the target levels indicated in the analysis, following a significant bullish trend.
Please note that this is merely a trading idea and not a signal. It could either succeed or fail, so I encourage you to conduct your own research and analysis before making any trading decisions.

USDCAD Short! 23/4/2024Short for fake breakout. W1 hit resistance, D1 smooth downtrend, H4 break support.
SL - 1.37829, TP - 1.35411.

long on the rectangle*The content on this analysis is subject to change at any time without notice, and is provided for the sole purpose of assisting traders to make independent investment decisions.

USDCAD LOOKOUTAre the bulls on UsdCad finally ready to throw in the fight or the bears are ready to take over. So far nothing has been confirmed and we wait for the market to give us its stance on the matter
