EURUSD(20250714) Today's AnalysisMarket news:
① Fed's Goolsbee: The latest tariff threat may delay rate cuts. ② The Fed responded to the White House's "accusations": The increase in building renovation costs partly reflects unforeseen construction conditions. ③ "Fed's megaphone": The dispute over building renovations has challenged the Fed's independence again, and it is expected that no rate cuts will be made this month. ④ Hassett: Whether Trump fires Powell or not, the Fed's answer to the headquarters renovation is the key.
Technical analysis:
Today's buying and selling boundaries:
1.1689
Support and resistance levels:
1.1738
1.1719
1.1707
1.1670
1.1658
1.1640
Trading strategy:
If the price breaks through 1.1689, consider buying in, with the first target price of 1.1707
If the price breaks through 1.1670, consider selling in, with the first target price of 1.1658
U.S. DOLLAR / EURO REFERENCE RATE
1.1665EURR
−0.0025−0.21%
Last update at Jul 15, 14:01 GMT
EUR
No trades
USDEUX trade ideas

EURUSDHello Traders! 👋
What are your thoughts on EURUSD?
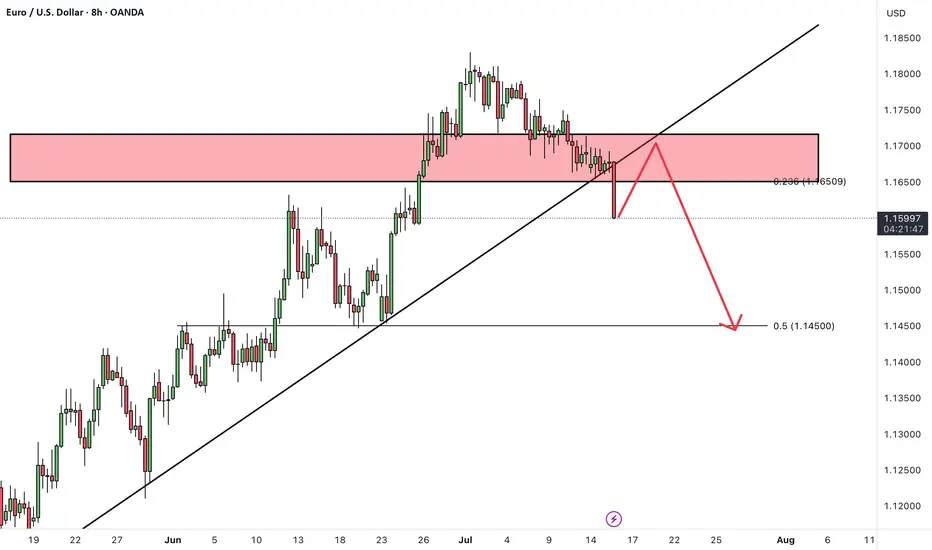
EURUSD has broken support level and its ascending trendline, indicating a possible shift in short-term market structure and growing bearish pressure.
In the short term, we expect a pullback toward the broken support/trendline zone.
If price fails to reclaim this level, a continued move lower toward the next identified support zone is likely.
As long as price remains below the broken structure, the short-term outlook stays bearish.
Don’t forget to like and share your thoughts in the comments! ❤️

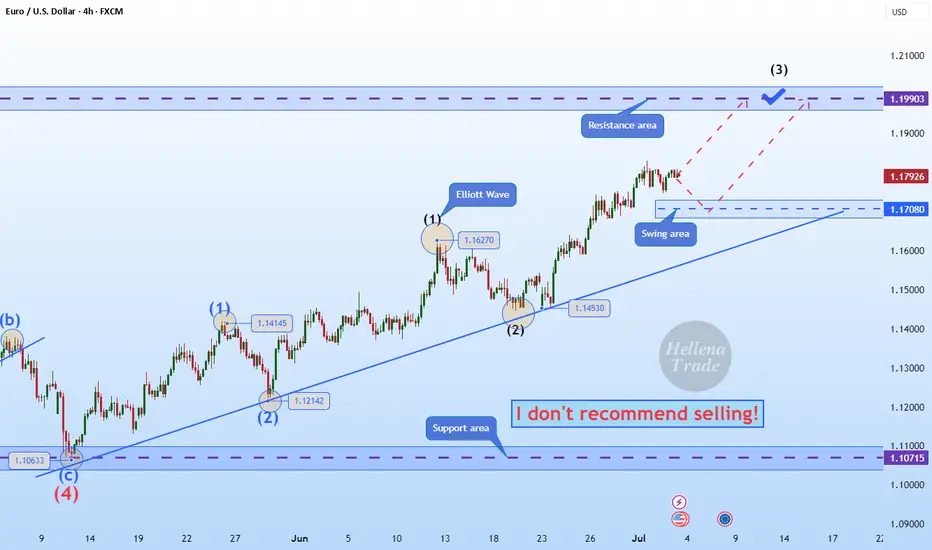
Hellena | EUR/USD (4H): LONG to the resistance area 1.20000.Colleagues, I believe that the upward impulse is not over yet. Wave “3” of the higher order and wave “3” of the lower order are just completing their movement, and I think that at the moment it is worth looking at the resistance area of 1.20000.
This is a very attractive psychological level where wave “3” could complete its upward movement.
Manage your capital correctly and competently! Only enter trades based on reliable patterns!
ETHEREUM - ETH Weekly Recap & Projection 13.07.2025Current Structure
Ethereum is showing a clear bullish bias.
Last week’s price action broke above a significant weekly swing level with solid candle closures — suggesting continuation.
Short-Term Scenarios
We could see two potential outcomes:
• A consolidation range forming at current levels
• A short-term retracement influenced by Bitcoin’s movement
Due to ETH’s high correlation with BTC, traders should review Bitcoin’s chart to understand ETH’s likely path.
Trading Plan
Wait for Bitcoin to complete a retracement
Monitor ETH for LTF (lower timeframe) confirmation and bounce
Seek long setups below the CME Gap (pink line)
Step 2 will serve as the trigger to initiate any positions on ETH.
Macro Risk-On Catalyst – Powell Resignation?
There are growing rumors regarding Federal Reserve Chairman Jerome Powell potentially resigning.
If confirmed, this could result in a strong rally across risk assets, including ETH — likely pushing prices higher without traditional pullbacks.
Summary
• ETH broke major weekly structure
• Watch BTC for clues — correlation remains high
• Plan favors long entries after BTC retrace + ETH LTF confirmation
• Powell resignation rumors could accelerate bullish trend

EUR/USD Daily OB Analysis – ICT-Based SetupEUR/USD Daily OB Analysis – ICT-Based Setup
This is a clean ICT-style analysis of EUR/USD on the Daily timeframe.
A Daily Bullish Order Block (OB) has been identified in the Discount zone.
The OB ranges between two psychological levels:
1.15500 – Mid Figure
1.15000 – Big Figure (key liquidity level)
The market is currently approaching this OB, and the region is well aligned with the principles of PD Arrays (Premium/Discount Arrays) from ICT methodology.
The OB is considered valid as price action broke market structure (BOS) after the OB was formed, confirming institutional interest at that level.
We are now watching for potential bullish confirmation signals (MSS, SMT divergence, or bullish FVGs) on lower timeframes like H1 or M5 as price taps into the OB zone.
This setup offers a high-probability long opportunity, especially if price reacts from the 1.15000 big figure level with bullish price action.

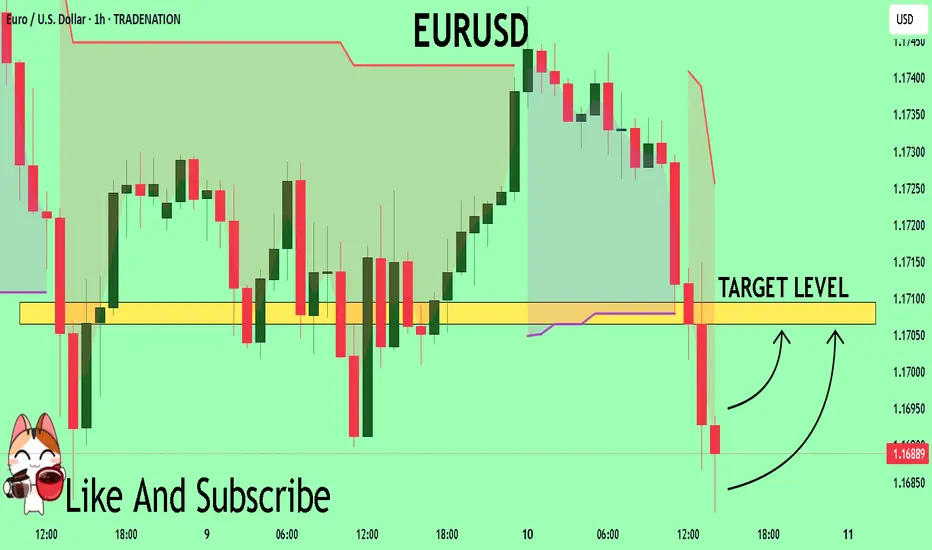
MarketBreakdown | EURUSD, DOLLAR INDEX, BITCOIN, SILVER
Here are the updates & outlook for multiple instruments in my watch list.
1️⃣ #EURUSD daily time frame 🇪🇺🇺🇸
The price started a correctional movement after it updated
a high the first of July.
The market formed a bullish flag pattern.
Your next trend-following bullish signal will be a breakout and a daily
candle close above its resistance.
2️⃣ Dollar Index #DXY daily time frame 💵
The market corrects in a bearish flag pattern.
I see a test of a significant horizontal resistance cluster now.
Your signal to see will be a bearish violation of a support
of the flag and a daily candle close below.
3️⃣ #BITCOIN #BTCUSD daily time frame
Though the price managed to update the All-Time High
yesterday, the market did not manage to close above
a current major resistance.
I believe that we will see another attempt of the market to breakthrough.
Your bullish confirmation will be a daily candle close above the underlined resistance.
4️⃣ #SILVER #XAGUSD daily time frame 🪙
The price reached an important confluence demand zone
based on a rising trend line and a horizontal key structures support.
Probabilities will be high to see a bullish movement from that.
Do you agree with my market breakdown?
❤️Please, support my work with like, thank you!❤️
I am part of Trade Nation's Influencer program and receive a monthly fee for using their TradingView charts in my analysis.

What’s EURUSD Telling Us on the 30-Minute Chart?🌅 Good morning, my friends,
EURUSD just made a pullback within the last 30 minutes, so I entered a sell position based on that move.
🎯 Targets:
- TP1: 1.17607
- TP2: 1.17475
- TP3: 1.17174
🛑 Stop Loss: 1.17938
📊 Risk/Reward Ratio: 2.00
Your likes and support are what keep me motivated to share these analyses consistently.
Huge thanks to everyone who shows love and appreciation! 🙏

EURUSD long Lion SETUPhello everyone
the price is in a strong demand area
as liquidity has been withdrawn
and the fair value gap has been filled
but we are waiting for formation pattern on a smaller frame in order to enter an upward wave.
we also have resistance area
so in short. I expect an upside go upppp
EURUSD Will Explode! BUY!
My dear followers,
I analysed this chart on EURUSD and concluded the following:
The market is trading on 1.1686 pivot level.
Bias - Bullish
Technical Indicators: Both Super Trend & Pivot HL indicate a highly probable Bullish continuation.
Target - 1.1706
About Used Indicators:
A super-trend indicator is plotted on either above or below the closing price to signal a buy or sell. The indicator changes color, based on whether or not you should be buying. If the super-trend indicator moves below the closing price, the indicator turns green, and it signals an entry point or points to buy.
Disclosure: I am part of Trade Nation's Influencer program and receive a monthly fee for using their TradingView charts in my analysis.
———————————
WISH YOU ALL LUCK
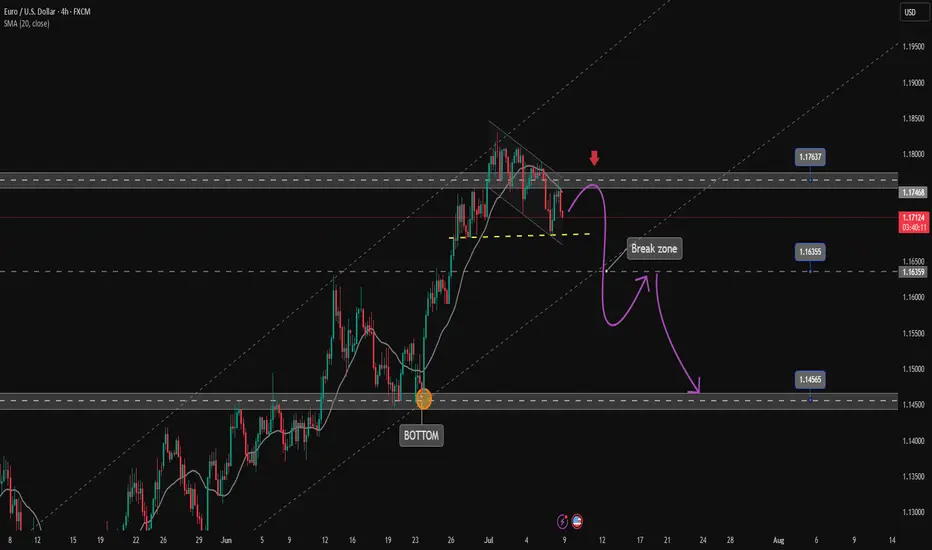
Confirming EURUSD corrective downtrend✏️EURUSD is trading in a downtrend channel. SELL signal is triggered at the current price around 1.172 as the H4 candle failed to break 1.176 and confirmed the Sellers' entry into the market clearly. Target for the downtrend is at 1.145, the Sellers' strength needs to overcome the Break out zone of 1.163 first.
📈 Key level
Support 1.163-1.146
Resistance 1.176
SELL DCA Trigger: Break 1.163
BUY Trigger: The price trades about 1.163.
EURUSD BUY So we have nice weekly fvg below along with a strong pivot point we could possibly see price reach this level before the push to the upside. I’m pretty confident we will have a strong push to the upside due to the macroeconomics and positioning of key players as they are still very bullish on the euro as we still creating higher highs consistently. A lot of people are in sells right now so we could see them taken out before the move to the downside they the EurUsd buy will be in play .

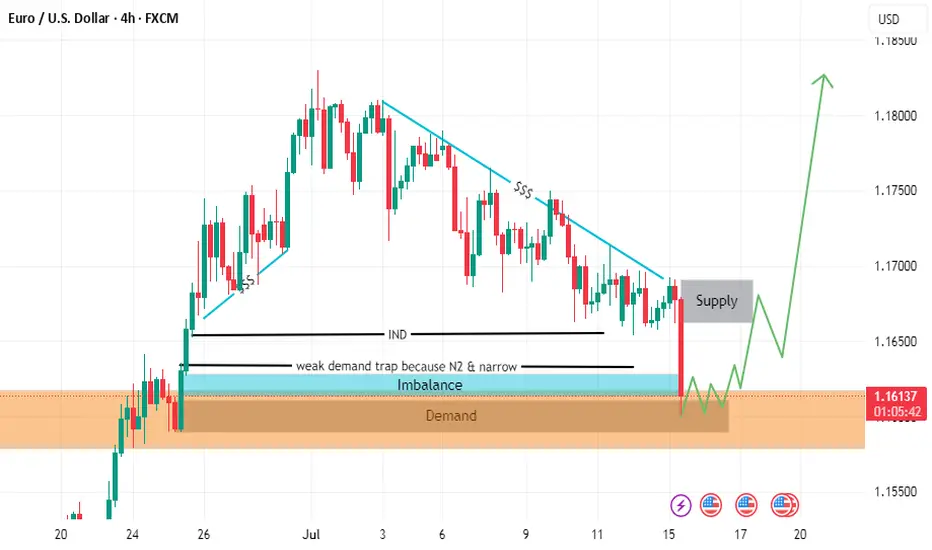
EURUSD H4 RISES 🔄 Disrupted EUR/USD Analysis (4H)
📉 Current Structure:
Price is hovering around 1.17298, showing hesitation at the resistance of a potential bearish flag.
While the chart labels this zone as “bullish,” there are signs of market indecision, possibly a fakeout trap.
⚠️ Key Disruptions:
1. Bullish Trap Risk:
The price formed a short-term M-pattern (double top inside the orange circle), indicating bearish exhaustion rather than continuation.
The expected breakout to the upside may fail if bulls don’t sustain volume.
2. Support Area Weakness:
The support zone around 1.17000 has been tested multiple times. If it breaks, it could turn into a strong resistance, flipping the sentiment.
3. Macro Influence:
Upcoming EUR and USD economic events (noted by icons) could cause high volatility and break structure unexpectedly.
A strong USD report could reverse bullish momentum, sending EUR/USD toward 1.16500 or lower.
4. Bearish Continuation Scenario:
If the market breaks down from the current consolidation, expect targets at:

Two Brains, One Trade: Why You Freeze Under PressureBy MJTrading:
In trading, your biggest opponent isn’t volatility.
It’s your own neural wiring.
Every trader operates with two main systems:
🧠 System 2 – Rational, deliberate, planning (Prefrontal Cortex)
🧠 System 1 – Emotional, instinctive, fast (Amygdala & Limbic Brain)
Before entry, System 2 is in control. You feel calm, logical.
But the moment money is at risk—especially in drawdown or after a missed TP—System 1 takes over.
💥 Stress hormones spike
💥 Focus narrows
💥 Long-term thinking disappears
💥 You freeze, or act impulsively
You knew what to do.
But you didn’t do it.
Because in that moment, your rational mind wasn’t driving anymore.
⚖️ Set & Forget vs. Floating Managers
Different trading personalities react differently under pressure:
🔹 Set & Forget Traders
Rely on automation or predefined exits to bypass emotional hijack.
They reduce cognitive load, but often feel regret when price goes “a little more.”
🔹 Floating Management Traders
Rely on intuition and live feeling. They stay with the chart, adjusting based on flow.
When calm and trained, they shine.
But under pressure, they’re more vulnerable to emotional loops:
– hesitation
– premature exits
– revenge tweaks
– system betrayal
🧘♂️ What can you do?
✔️ Pre-plan decisions
Make the hard calls before emotions kick in.
✔️ Mental rehearsal
Visualize trade management scenarios—yes, like athletes do.
✔️ Create fallback protocols
So if you freeze, your system still knows what to do.
🧠 For Those Who Want to Go Deeper:
“Thinking, Fast and Slow” by Daniel Kahneman
Understand System 1 & 2 thinking—and how cognitive bias shapes all decisions, not just trades.
“The Hour Between Dog and Wolf” by John Coates
A stunning look at how biology, hormones, and risk-taking collide in traders' brains.
🔓 Final Thought:
If your strategy works in theory, but breaks in real-time—
It’s time to work on your neural execution layer.
Because in trading, you don’t rise to your level of analysis—
you fall to your level of emotional wiring.
— MJTrading
#NeuroTrading #TraderTypes #TradingPsychology #SetAndForget #FloatingManagement #MindOverMarkets #EURUSD #MJTrading
Previous psychology Ideas:


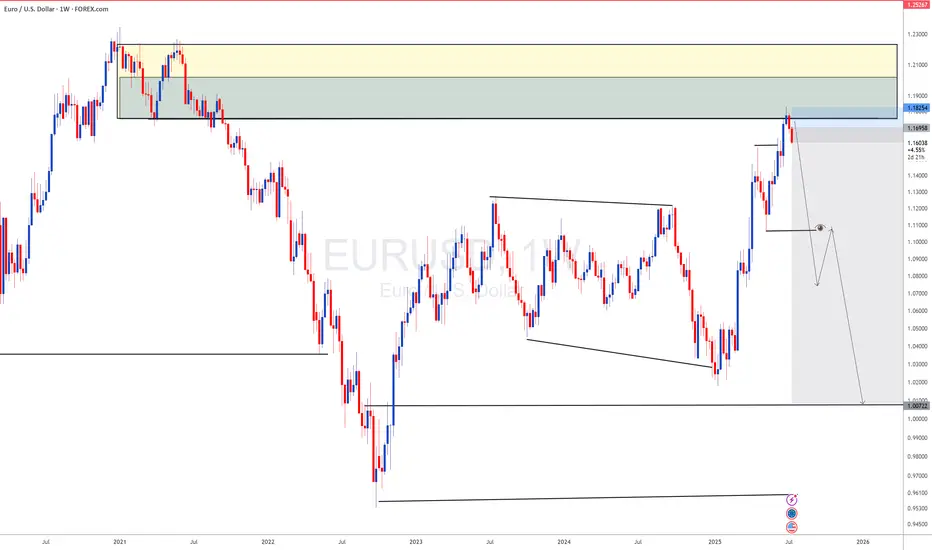
The euro's bearish structure remains unchanged.EUR/USD rebounded from around the three-week low of 1.1655 during the European session. However, the overall trend of the exchange rate remains within the descending channel that has been in place since early July. Market concerns over the U.S. government's new 30% tariff measures have dampened risk appetite, limiting the room for the exchange rate to rebound.
In the short term, the exchange rate is expected to contend within the 1.1650-1.1700 range. Analysts believe that if the euro fails to break through and stabilize above the 1.1700 threshold, the bearish structure will remain intact, and the exchange rate will continue to test lower support levels such as 1.1630 and 1.1600. A breakdown below these levels could open up further downside space, with the target pointing to around the lower Bollinger Band at 1.1387.
you are currently struggling with losses,or are unsure which of the numerous trading strategies to follow,You have the option to join our VIP program. I will assist you and provide you with accurate trading signals, enabling you to navigate the financial markets with greater confidence and potentially achieve optimal trading results.

Bullish Flag Formation Signals Potential Uptrend on EUR/USDThis chart shows a clear bullish flag pattern on the EUR/USD 3-hour timeframe. After a strong impulsive move upward, the price is consolidating within a downward-sloping channel, characteristic of a flag formation. The Ichimoku Cloud supports the consolidation zone, with price currently testing the lower boundary of the flag. A breakout above the upper trendline would confirm continuation of the bullish trend. The chart indicates a strong potential for an upward breakout following the flag’s structure, in line with the prevailing bullish momentum. This setup favours bulls, anticipating continuation of the uptrend once resistance is cleared.
Entry Buy : 16400
First Target: 1.17500
Second Target : 1.18100
If you found this analysis helpful, don’t forget to drop a like and comment. Your support keeps quality ideas flowing—let’s grow and win together! 💪📈

EURUSD LONG The dollar is looking to fall hard as the euro continues to gain we still see the market long on the euro in terms of institutions etc. we had a weak push to the downside and have now met trend line resistance will be interesting to see what happens from here . The trade isn’t perfect yet but this is what I’m looking at so far .

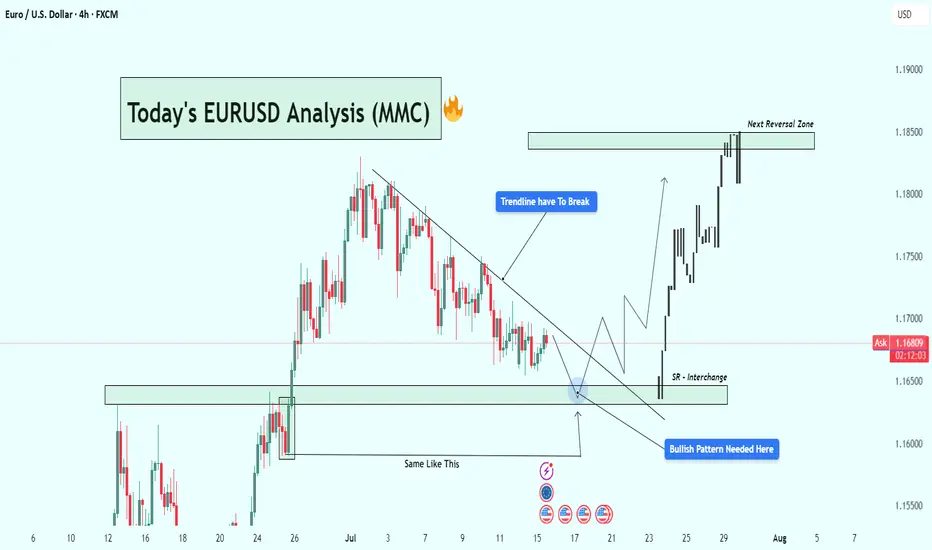
EURUSD Analysis : Eyes on Bullish Breakout Setup + Target🧭 Current Market Context:
The EURUSD pair is currently trading near 1.16765 on the 4H timeframe, displaying classic accumulation behavior at a key Support-Resistance Interchange Zone (SR Flip). After an extended bearish correction from the previous swing high, price has started compressing in a descending structure underneath a well-respected trendline. This tightening range near a historic support zone suggests that a major breakout could be on the horizon.
🧠 Technical Confluences:
🔹 1. Descending Trendline - Bearish Control Line:
The trendline drawn from the July highs has acted as a clear resistance line, rejecting multiple bullish attempts to break higher.
Price has failed to close above it on the 4H chart, showing sellers are still in control—but momentum is fading.
A breakout of this line is a crucial confirmation of buyer strength returning.
🔹 2. SR Flip Zone - Interchange Area:
This zone previously acted as resistance, capping the rally in June.
After price broke above it, the same area now acts as support, confirming its role as an SR flip zone—a textbook demand level.
Smart money often steps in at these interchange areas to accumulate long positions.
🔹 3. Re-accumulation Phase (Smart Money Behavior):
Market structure is showing a rounded bottom formation, hinting at possible absorption of sell-side liquidity.
Price action is compressing into the support zone, reducing volatility—a signal that a reversal or breakout is near.
The previous similar move ("Same Like This") from late June led to a strong bullish impulsive wave—this historical behavior adds confidence in the current bullish outlook.
🔹 4. Potential Bullish Pattern:
Price needs to develop a bullish reversal pattern (e.g., inverse head & shoulders, bullish engulfing, or a sweep of the low with rejection).
Only then will the setup be validated. This is not a blind buy zone, but a zone of interest for high-probability longs if price confirms.
🧨 Trade Plan Scenarios:
✅ Scenario 1 - Confirmation Breakout:
Wait for a clean breakout above the descending trendline.
Enter on breakout + retest structure.
Target the next major reversal zone at 1.18500.
🐢 Scenario 2 - Early Long Entry:
Enter on bullish confirmation (engulfing, pin bar, etc.) at the SR Interchange zone.
Stop loss below the support box.
Ride early for better R:R if the breakout confirms.
❌ Invalidation:
A clean breakdown below 1.1600 with momentum will invalidate the bullish bias.
In that case, reevaluate based on new structure.
📊 Projected Path:
If the trendline breaks, expect a bullish rally toward the next major resistance zone (1.18500).
That zone has historically acted as a major reversal and profit-taking level for bulls, and we expect price to react again if tested.
🔍 Macro View (Optional Insight):
USD may show weakness due to macro data (CPI/FED talks), helping EURUSD lift.
Eurozone data stability could further fuel demand for EUR.
📌 Final Thoughts:
This EURUSD setup is forming at a high-value area, backed by technical structure, historical behavior, and smart money positioning. If the price reacts positively from this zone and breaks the descending trendline, it could trigger a bullish leg toward 1.18500, offering a rewarding risk-to-reward opportunity for both swing and short-term traders.
Stay patient. Let the market confirm the direction before execution. 📈
EURUSD Bearish SMC Setup | Premium Supply Rejection + CHoCH +FVGPair: EUR/USD
Timeframe: 4H
Price reacted strongly from a Premium Selling Zone, forming multiple CHoCH (Change of Character) and BOS (Break of Structure) confirmations.
🔻 Red Zones indicate strong institutional selling
🔺 Weak High is now likely to remain protected
Market structure has shifted bearish, and price is targeting imbalances (IMB) and Fair Value Gaps (FVG) below.
⸻
✅ Entry: Taken from the premium supply rejection
🎯 Target 1: 1.16000 – Minor imbalance fill
🎯 Target 2: 1.15000 – Mid-level demand
🎯 Final Target: 1.14500 – Major liquidity zone
❌ Invalidation: Clean break above 1.18000
⸻
📉 Smart Money Confirmation Setup:
• Premium Supply
• CHoCH
• BOS
• FVG & IMB below
🔄 Missed the entry? Wait for a pullback into lower OB or supply zone.
#EURUSD #SmartMoney #SMC #CHoCH #BOS #FVG #OrderBlock #Forex #LiquiditySweep #SupplyDemand

EUR/USD Price Action – Liquidity Grab & Demand Zones This 1-hour EUR/USD chart highlights key intraday price levels and potential trading zones. The chart identifies the Previous Day High (PDH), New York Session High (NY HIGH), and Previous Day Low (PDL). A notable Trap/Demand Zone just below the Asia High suggests a potential liquidity grab before a reversal or continuation move. Price is currently reacting within this zone, and traders may watch for confirmations of either a bullish continuation toward the PDH or a bearish rejection back to the PDL. The marked zones serve as potential trade entry/exit reference points for intraday strategies.

EURUSD: Will Go Down! Short!
My dear friends,
Today we will analyse EURUSD together☺️
The recent price action suggests a shift in mid-term momentum. A break below the current local range around 1.16802 will confirm the new direction downwards with the target being the next key level of 1.16684.and a reconvened placement of a stop-loss beyond the range.
❤️Sending you lots of Love and Hugs❤️