Analysis The market has gotten to the H1 FVG and idn it. Now we need to look for short opportunity. The lq has been taken.
U.S. DOLLAR / EURO REFERENCE RATE
1.1726EURR
+0.0027+0.23%
Last update at Jul 23, 14:01 GMT
EUR
No trades
USDEUX trade ideas

Buying opportunities on EURUSDYesterday, EURUSD saw a sharp spike after reports that Trump might fire the Federal Reserve Chair.
Although this wasn’t confirmed, the news triggered short-term volatility before the market settled down again.
At the moment, EURUSD is reacting to key support levels. Watch for the formation of a higher low and potential signs of a new bullish move.
The goal remains a breakout above the previous high and continuation of the main uptrend.


Bullish momentum to extend?The Fiber (EUR/USD) is reacting off the pivot which is a pullback support that aligns with the 61.8% Fibonacci retracement and could bounce to the 1st resistance.
Pivot: 1.1584
1st Support: 1.1448
1st Resistance: 1.1809
Risk Warning:
Trading Forex and CFDs carries a high level of risk to your capital and you should only trade with money you can afford to lose. Trading Forex and CFDs may not be suitable for all investors, so please ensure that you fully understand the risks involved and seek independent advice if necessary.
Disclaimer:
The above opinions given constitute general market commentary, and do not constitute the opinion or advice of IC Markets or any form of personal or investment advice.
Any opinions, news, research, analyses, prices, other information, or links to third-party sites contained on this website are provided on an "as-is" basis, are intended only to be informative, is not an advice nor a recommendation, nor research, or a record of our trading prices, or an offer of, or solicitation for a transaction in any financial instrument and thus should not be treated as such. The information provided does not involve any specific investment objectives, financial situation and needs of any specific person who may receive it. Please be aware, that past performance is not a reliable indicator of future performance and/or results. Past Performance or Forward-looking scenarios based upon the reasonable beliefs of the third-party provider are not a guarantee of future performance. Actual results may differ materially from those anticipated in forward-looking or past performance statements. IC Markets makes no representation or warranty and assumes no liability as to the accuracy or completeness of the information provided, nor any loss arising from any investment based on a recommendation, forecast or any information supplied by any third-party.

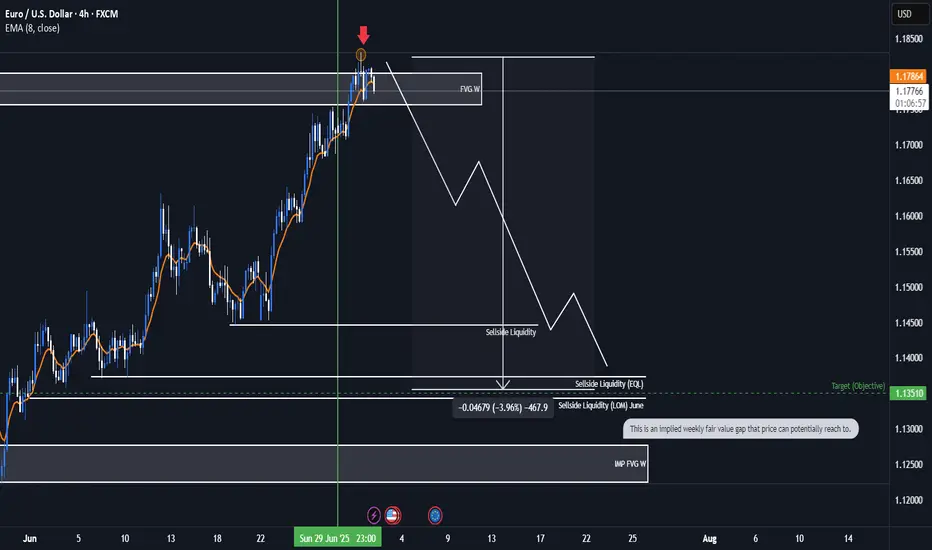
EURUSD Bearish ideaWe are in a weekly fair value gap that we have balance and potentially collected orders to prepare for a potential drop in price. We are anticipating a quarterly shift for the month of July were we could be targeting downside liquidity that is in open float.
* Fundamentals:
-Interest rate differentials shows us that USD interest rate of 4.5 is higher than the interest rate EUR 2.15 which lead to the longer fundamental frame work of price correcting to the higher dollar rate to the euro.
-The COT report also indicates to us that there is huge buying of Dollar by the commercials and a huge amount of selling of the EUR by commercials which can lead us to assume potential weaker dollar.
*Targeting:
-We are looking for the low of last month (June) to be taken out as well as even potentially reaching to the implied weekly fair value gap.

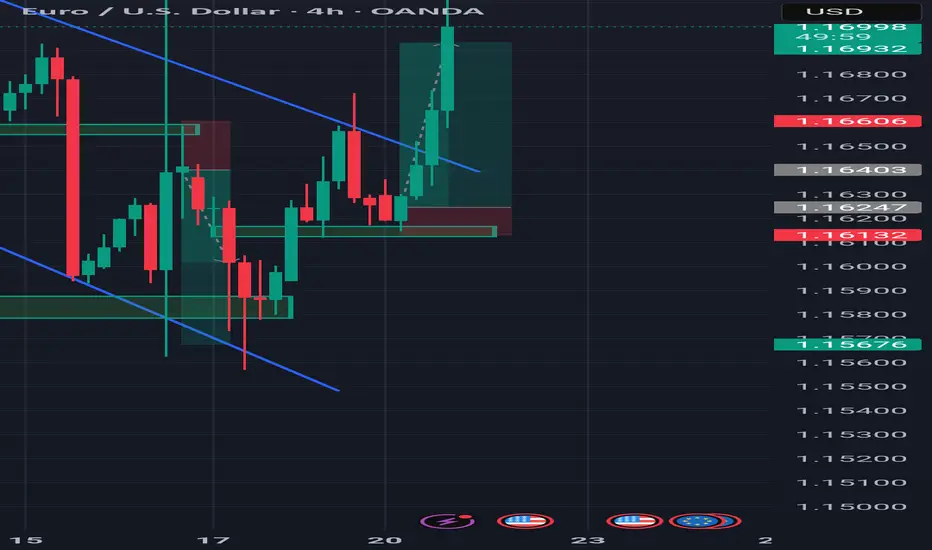
BUY EURUSD now for 4h time frame bullish trend continuation BUY EURUSD now for 4h time frame bullish trend continuation ...............
STOP LOSS: 1.1615
This buy trade setup is based on hidden bullish divergence trend continuation trading pattern ...
Always remember, the trend is your friend, so whenever you can get a signal that the trend will continue, then good for you to be part of it
TAKE PROFIT : take profit will be when the trend comes to an end, feel from to send me a direct DM if you have any question about take profit or anything...
Remember to risk only what you are comfortable with... trading with the trend, patient and good risk management is the key to success here

EURUSD is close to the end of its correctionEURUSD is consolidating in a wedge. The trend is bullish, with the correction reaching the 0.7 Fibonacci zone and making a false breakout, which generally changes the market imbalance.
All attention is on the wedge resistance (red line) and the 1.17000 level. A breakout of the resistance and consolidation of the price above this level will confirm the end of the correction and send the price higher.

MSFT longThis is a After a strong pullback and a clear rejection at key support levels, the EUR/USD pair is showing signs of a potential reversal. Technical indicators suggest oversold conditions, making this an attractive entry for bullish traders.
🎯 Entry: Around 1.15873
🛑 Stop Loss: Below 1.19700
💰 Take Profit: 1.0750 – 1.14385
Always trade with proper risk management and confirm with your own analysis!good trade


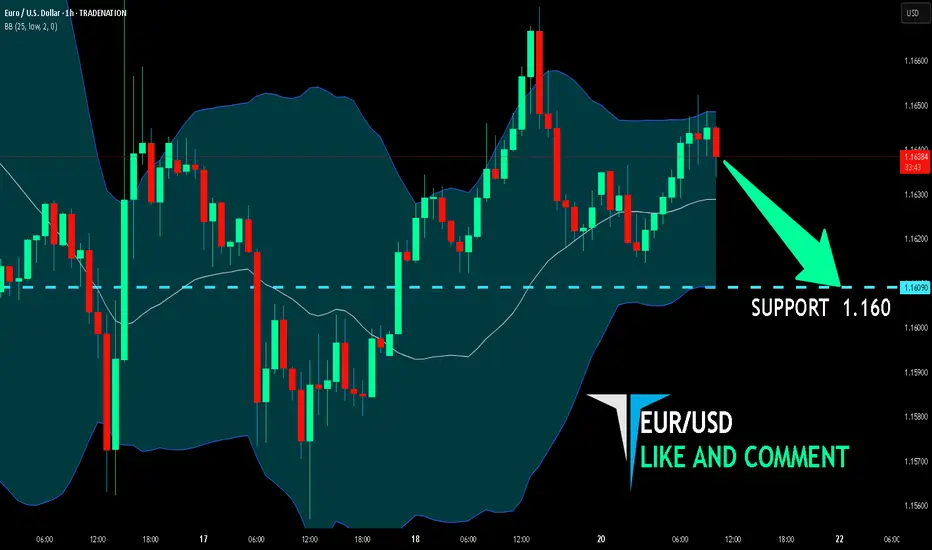
EUR/USD BEST PLACE TO SELL FROM|SHORT
Hello, Friends!
EUR/USD is making a bullish rebound on the 1H TF and is nearing the resistance line above while we are generally bearish biased on the pair due to our previous 1W candle analysis, thus making a trend-following short a good option for us with the target being the 1.160level.
Disclosure: I am part of Trade Nation's Influencer program and receive a monthly fee for using their TradingView charts in my analysis.
✅LIKE AND COMMENT MY IDEAS✅
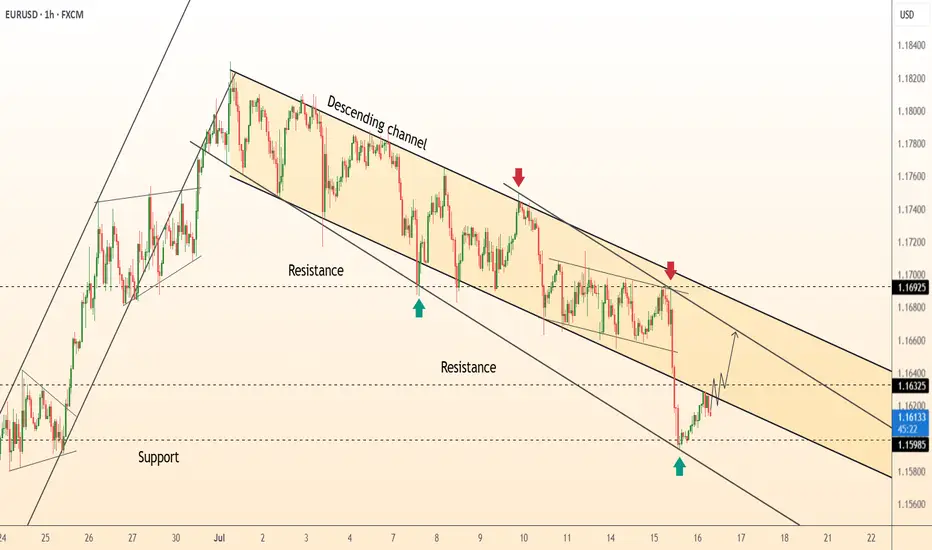
EURUSD FOUND SUPPORT, READY TO BREAK THE CHANNELEURUSD FOUND SUPPORT, READY TO BREAK THE CHANNEL🔥
EURUSD has been trading within the descending channel since the beginning of the descending channel. Recently the price reached the major trendline, graph started to show the bullish divergence on the RSI .
What is a bullish divergence?
A technical analysis pattern where the price makes lower lows, but a momentum indicator (e.g., RSI, MACD) forms higher lows, signaling weakening bearish momentum and a potential trend reversal upward.
So, another hike in this pair is expected. Possible direction: spike towards the SMA200, minor pullback and a further development of the bullish impulse.

EURO - Price will rise a little and then drop to $1.1500 pointsHi guys, this is my overview for EURUSD, feel free to check it and write your feedback in comments👊
Price earlier carved out a pennant pattern after a strong rally, with price oscillating between converging trendlines and indecision mounting near $1.1550 resistance.
After several weeks in consolidation, sellers finally broke down below the pennant base, sending price back toward the support area and trapping late buyers.
Buyers regrouped and launched a new advance, driving EUR into a well-defined rising channel.
During this channel run, two notable breakouts above interim highs were quickly followed by exits at the upper trendline.
Price now sits in a tight consolidation just under the rising channel’s ceiling near $1.1700, forming small corrective swings on lighter volume.
I expect one more shallow rally toward $1.1750 before sellers overwhelm buyers again, pushing Euro down through $1.1550 and toward the $1.1500 points.
If this post is useful to you, you can support me with like/boost and advice in comments❤️
Disclaimer: As part of ThinkMarkets’ Influencer Program, I am sponsored to share and publish their charts in my analysis.

DeGRAM | EURUSD rebound from the trend line📊 Technical Analysis
● Price printed a hammer and bullish RSI divergence on the lower rail of the 3-week descending channel (green arrow 1.1598), breaking the inner wedge that guided last leg down.
● First resistance is the channel mid-line / prior pivot 1.1632; a move through it exposes the upper band near 1.1692, where July supply and the larger bearish trend-line converge.
💡 Fundamental Analysis
● Softer US retail-sales control-group and Daly’s “more evidence needed” remarks cooled 2-yr yields, trimming dollar support, while ECB’s Knot said additional cuts “are not imminent,” limiting euro downside.
✨ Summary
Long 1.1600-1.1620; hold above 1.1632 targets 1.1690. Long view void on an H1 close below 1.1580.
-------------------
Share your opinion in the comments and support the idea with a like. Thanks for your support!
EURUSD Bullish Continuation Patterns and Consistent Demand The bullish continuation patterns and the consistent daily demand zones indicate that the trend is still bullish despite last week's bearish correction.
Price is currently reacting to a daily support zone. To confirm going long, especially long term, I recommend waiting for the current falling wedge to breakout and retest and then ride the bullish momentum to daily and weekly supply zones.

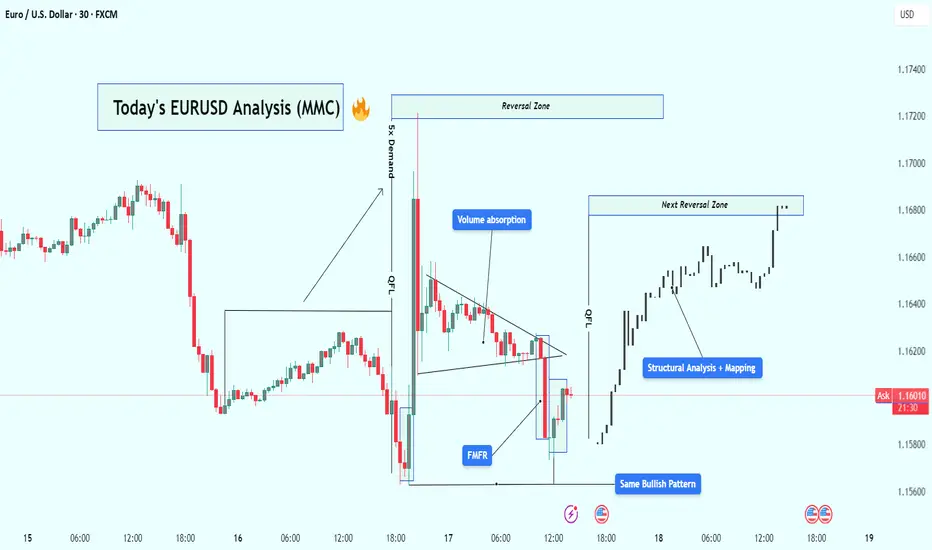
EUR/USD Analysis : Bullish Reversal – Volume Absorption & Target🧠 Market Overview:
EUR/USD has followed a flawless Market Maker Cycle, moving from manipulation to expansion. The chart shows institutional behavior through liquidity grabs, volume absorption, and structural breaks, confirming that big players are in full control.
The current price action signals bullish strength targeting the next high-probability reversal zone, but let’s break this down from the very beginning.
🔍 Key Chart Phases and Insights:
1️⃣ Massive Bearish Impulse – Liquidity Sweep Phase
At first glance, the chart shows an aggressive drop — a strong bearish leg that looks like market weakness.
❗ But in reality, this is the liquidity sweep phase. Here’s what likely happened:
Price ran below key lows
Hit stop losses of early buyers
Created “fake” bearish sentiment
Built sell-side liquidity for institutions to buy from
🔑 This isn’t weakness — it’s a setup.
2️⃣ FMFR (Final Move for Reversal) + Instant Reaction
At the end of that drop, the market printed a sharp bullish engulfing candle from the lows — this is known as the Final Move for Reversal (FMFR).
This marks:
The end of the accumulation phase
Entry of smart money into the market
The beginning of a new bullish cycle
The size and speed of this move indicate high-volume orders were filled — classic sign of institutional presence.
3️⃣ 5x Demand Push – Start of Expansion Phase
After the FMFR, price explodes upward with 5 consecutive bullish candles. This is your expansion phase — the market is moving fast, breaking structure, and flipping direction.
Key takeaways from this leg:
Strong displacement confirms a new trend
High momentum candles reflect institutional interest
Price breaks above previous structure levels
📈 This is no longer random — it’s planned and executed by bigger players.
4️⃣ Volume Absorption in Tight Wedge – Smart Money Re-Accumulation
After the breakout, price doesn’t just continue flying — instead, it compresses in a tight triangle. This is a key phase called volume absorption or re-accumulation.
What’s happening here:
Institutions are absorbing retail orders
Low volume = no resistance = easier breakout
Price is “charging” before the next move
🔋 Think of this like coiling a spring — it’s getting ready to pop again.
5️⃣ Bullish Pattern Repeats – MMC Confirmed
Interestingly, we now see the same bullish pattern forming again on the right side of the chart, similar to the first FMFR.
This is powerful because:
Pattern repetition means consistent order flow
Smart money is using the same blueprint
It gives us confidence to follow the trend
⚠️ When the same bullish setup happens twice — it’s not by chance.
6️⃣ Structural Mapping – Road to Reversal Zone
On the far right, we’ve entered clean bullish structure, making higher highs and higher lows.
We are now targeting:
The next Reversal Zone near 1.16800
This zone could act as resistance or another trap
A strong reaction from this zone can trigger either profit-taking or short-term reversal
Price is currently in the "continuation" part of MMC, heading toward premium levels.
📈 Trading Plan Based on This Setup:
✅ Primary Bullish Plan:
Price respects current structure
Breaks minor highs with strong volume
Entry on retracement to broken structure
Target: 1.16800 reversal zone
⚠️ Alternate Bearish Setup (If Price Rejects Reversal Zone):
Sharp rejection from reversal zone
Break of structure (BOS) on lower timeframe
Entry on lower high retest
Target: Liquidity areas below 1.16200
🧵 Conclusion:
This EUR/USD chart is a blueprint of institutional market flow. From the liquidity sweep, to volume absorption, to repeating bullish patterns, we’re seeing a textbook Market Maker Cycle (MMC) play out.
Here’s what makes this chart powerful:
✔️ Volume confirms structure
✔️ Reversal zones are clearly defined
✔️ Same bullish pattern = smart money roadmap
✔️ Trade setups are clean with defined risk
✅ This is the kind of setup you wait days for — don’t rush, follow structure, and execute with confirmation.
EURUSD: Detailed Support & Resistance Analysis 🇪🇺🇺🇸
Here is my latest structure analysis and important
supports and resistances for EURUSD for next week.
Consider these structures for pullback/breakout trading.
❤️Please, support my work with like, thank you!❤️
I am part of Trade Nation's Influencer program and receive a monthly fee for using their TradingView charts in my analysis.

EURUSD Will Go Down! Short!
Please, check our technical outlook for EURUSD.
Time Frame: 3h
Current Trend: Bearish
Sentiment: Overbought (based on 7-period RSI)
Forecast: Bearish
The price is testing a key resistance 1.161.
Taking into consideration the current market trend & overbought RSI, chances will be high to see a bearish movement to the downside at least to 1.155 level.
P.S
Please, note that an oversold/overbought condition can last for a long time, and therefore being oversold/overbought doesn't mean a price rally will come soon, or at all.
Disclosure: I am part of Trade Nation's Influencer program and receive a monthly fee for using their TradingView charts in my analysis.
Like and subscribe and comment my ideas if you enjoy them!

EURUSD and Elliott Wave PrinciplesWe are currently on a Wave 5 that started when Wave 4(Red) completed. This 5th Wave expresses itself in 5 waves that are shown in Black. Our Wave 2 was a Zigzag and and we should expect a Flat correction for our Wave 4. When Wave 3 is complete an A Wave retests on the 261.8% Fib. level. Wave B goes beyond the end of Wave 3 and retests the confirms at the 423.6% Fib. level. This indicates the end of Wave B and the start of Wave C of the Flat, hence our Wave 4.

EURUSD Bullish ProjectionIt’s been a while since my last update here.
Here’s my projection and actual entry/entries on EURUSD, based on a sweep of the previous 1H swing low and mitigation of a Daily imbalance (Fair Value Gap).
We're anticipating a full Change of Character to mark the end of the ongoing Daily pullback.

EUR/USD Elliott Wave Update –Classic Wave 5 Breakout OpportunityThis chart of the EUR/USD pair shows a well-structured Elliott Wave impulse pattern unfolding on the 4-hour timeframe. The price action is currently progressing in the final Wave (5) of the impulse cycle, which typically represents the last bullish leg before a larger correction begins.
Wave (1): The initial move up from the bottom (early May), showing a clean 5-wave internal structure.
Wave (2): A healthy retracement after Wave 1, forming a base for further upside.
Wave (3): The strongest and steepest rally, as expected in Elliott theory. It broke past previous highs and extended sharply.
Wave (4): A corrective phase that formed a falling wedge pattern — typically a bullish continuation pattern.
Wave (5): Currently in progress. The wedge has broken to the upside, confirming the potential start of Wave 5.
Target 1 (T1): 1.18306
Target 2 (T2): 1.19012
Stop Loss (SL): 1.16600
After a strong uptrend, the market went sideways in a wedge pattern (a typical wave 4 behavior). It has now broken out, signaling the start of the final wave 5 move. This is often a strong and sharp push. Since the breakout is clean and the Elliott wave count aligns well, this creates a favorable long opportunity
