USDEUX trade ideas

EUR USD MAKE OR BREAK ?Eur usd breaking 1.05 level and attempting recovery from 1.02 level but only to get rejected. It was rejected twice confirming heavy sell above 1.05 level. Price action showing bears are in control of the area. If the bears manage to keep control of 1.05 level then we will most likely revisit 1.02 area or lower .

EURUSD Buy zone @1.07150 H4 chart analysisHere's a simple and effective post you can share with traders:
📊 EUR/USD Trade Setup 📊
🔹 Buy Zone: 1.07150
🔹 Target Point: 1.07500+
🔹 Stop Loss: 1.06303
🕵♂ H4 Chart Analysis:
✅ Strong support at 1.07150
✅ Potential bullish reversal signals
✅ Favorable risk-to-reward ratio
📌 Trade Wisely! Manage risk properly.
Would you like any modifications or a chart to go with it? Your buy zone at 1.07150 on the EUR/USD H4 chart suggests a potential support area where buyers might step in. Here are key factors to consider:
H4 Analysis
1. Support & Resistance:
If 1.07150 aligns with previous support levels, it could be a strong buy zone.
Look for confirmation via candlestick patterns (e.g., bullish engulfing, pin bar).
2. Trend & Structure:
Is the overall trend bullish or in a pullback?
If it's an uptrend, 1.07150 could be a great retracement entry.
If it's a downtrend, wait for strong rejection signals.
3. Indicators Confirmation:
Fibonacci Levels: Does 1.07150 align with 38.2%, 50%, or 61.8% retracement?
RSI & Stochastics: If oversold, a bounce is likely.
Moving Averages: Check for support around the 50/200 EMA.
4. Price Action Signals:
A strong bullish candle around 1.07150 increases the probability of reversal.
A break and retest pattern could confirm a safe entry.
Trade Setup
Entry: Buy around 1.07150 if confirmation appears.
Stop Loss: Below recent swing low (~1.07000 or lower).
Take Profit: Key resistance zones (1.07500, 1.07800, or higher).
Risk-Reward: Maintain at least 1:2 or 1:3 RR ratio.
Would you like an updated chart analysis or any specific insights on EUR/USD?


EUR/USD setup for downside move to the parity with USDDuring January and February EUR/USD was bulding nice upper trend line and building up the base for forming of bottom crossing important averages and resistance lines. Unfortunately upper move was negated and we broke down the 1.0422 important support. From now on I expect at lest retest of low 1.0177 in weeks and months to come with the door open to reach parity with US dollar and retest the 2022 lows.
Shorting / average price 1.0458. R/R 1:10.


EUR/USD BEARS WILL DOMINATE THE MARKET|SHORT
Hello, Friends!
Bearish trend on EUR/USD, defined by the red colour of the last week candle combined with the fact the pair is overbought based on the BB upper band proximity, makes me expect a bearish rebound from the resistance line above and a retest of the local target below at 1.024.
✅LIKE AND COMMENT MY IDEAS✅

EUR/USD Trend Today - Downtrend?EUR/USD news:
🔆The EUR/USD pair continues its downward trend for the third consecutive day, trading around 1.0390 during the Asian session on Friday. The Euro faces selling pressure due to increased risk aversion, driven by escalating trade tensions between the US and the EU. US President Donald Trump signaled the possibility of imposing “reciprocal” tariffs on the EU as soon as April.
🔆In response, a European Commission (EC) spokesperson stated that the EU would respond decisively and immediately to any unjustified trade barriers. This ongoing uncertainty may further weaken the Euro, adding to the bearish sentiment surrounding the EUR/USD pair.
🔆Meanwhile, the US Dollar Index (DXY), which tracks the performance of the USD against six major currencies, gained strength following the release of US GDP data on Thursday. At the time of writing, the DXY remains near 107.40.
Personal opinion:
🔆EUR/USD will continue to maintain a downtrend in the coming days due to the negative news still affecting. But there will be an increase to retest the resistance zone and then follow the downtrend
Analysis:
🔆Based on important resistance - support levels and Fibonacci combined with the SMA200 line to come up with a suitable strategy
Plan:
🔆 Price Zone Setup:
👉Sell EUR/USD 1.0420 – 1.0430
❌SL: 1.0460 | ✅TP: 1.0380– 1.0340 – 1.0300
FM wishes you a successful trading day 💰💰💰

EURUSD 28 Feb 2025 W9 -Intraday Analysis- US PCE Day! EOM FlowsThis is my Intraday analysis on FOREXCOM:EURUSD for 28 Feb 2025 W9 based on Smart Money Concept (SMC) which includes the following:
Market Sentiment
4H Chart Analysis
15m Chart Analysis
Market Sentiment
Heavy economic news:
EU : German Prelim CPI m/m
US : the most awaited report Core PCE Price Index m/m - Personal Spending m/m - Chicago PMI
The market sentiment detailed as following:
Trump's Tariff Announcements:
President Trump's announcements regarding new and increased tariffs significantly impacted market sentiment. Uncertainty surrounding trade relations with various countries, including the European Union, Mexico, and Canada, created volatility.
These tariff announcements created fears of trade wars, which negatively impacted investor confidence.
Economic Data:
Reports of declining new home sales in the U.S. and concerns about overall economic health contributed to market unease.
Also, the release of various economic data points, and the anticipation of the PCE inflation data release, influenced market movement.
NVIDIA's Performance and AI Competition:
While NVIDIA beat earnings estimates, concerns about increased competition from Chinese AI companies, particularly DeepSeek, led to a significant drop in its stock price, impacting the broader tech sector.
Geopolitical Uncertainty:
Geopolitical factors, such as the removal of Chevron's oil license in Venezuela, contributed to fluctuations in commodity prices, particularly oil.
Bank of Japan governor Ueda's statements regarding the uncertainty of US policies also added to uncertainty.
Additional Factors:
Geopolitical Resolution: A sudden de-escalation in a prior crisis (e.g., eased tensions in a conflict zone) might have reduced safe-haven demand for gold, though this was secondary to dollar strength.
Technical Factors: End-of-month rebalancing or options expirations could have amplified downward moves.
The interplay of a hawkish Fed, a resilient dollar, and risk aversion triggered broad-based declines. The overarching theme was a recalibration of investor expectations around tighter monetary policy and its implications for global growth and asset valuations.
4H Chart Analysis
1️⃣
🔹Swing Bullish (Reached Swing Extreme Demand)
🔹INT Bearish (Adjusted my INT structure to align with the previous Bullish move)
🔹Complex Swing INT Structure
2️⃣
🔹As the Swing is Bullish, expectations were set to continue Bullish targeting the Weak Swing High and create a Bullish BOS after the Deep Pullback to the Swing Demand.
🔹During the Swing Bullish Continuation after the Deep Pullback, INT Structure kept holding Bullish to fulfill the Bullish continuation phase.
🔹With price reaching the Swing Extreme Premium zone and the expectation of breaking the Weak Swing High, price failed 2 times and with the 3rd attempt it created a Bearish iBOS. This indicated that the Swing INT structure is Complex and the Daily/Weekly TFs are still in play.
3️⃣
🔹After the Bearish iBOS, we expect PB, there is no clear POI for price to initiate PB except the Liq. at 1.03730 and 1.03173 before mitigating the last clear 4H Demand.
🔹It’s not a must to reach these Liq. points as we already in a Daily partially mitigated Demand Zone and maybe some orders reside there. But Will need LTFs to show clear Bullish OF to confirm the 4H Bearish INT structure is staring the PB.
🔹Expectations is set to Bearish continuation till we have a clear Bullish OF. Also, keep in mind that Daily and Weekly are still Bearish and we may target the 4H Strong Swing Low to fulfill the Daily and Weekly move.
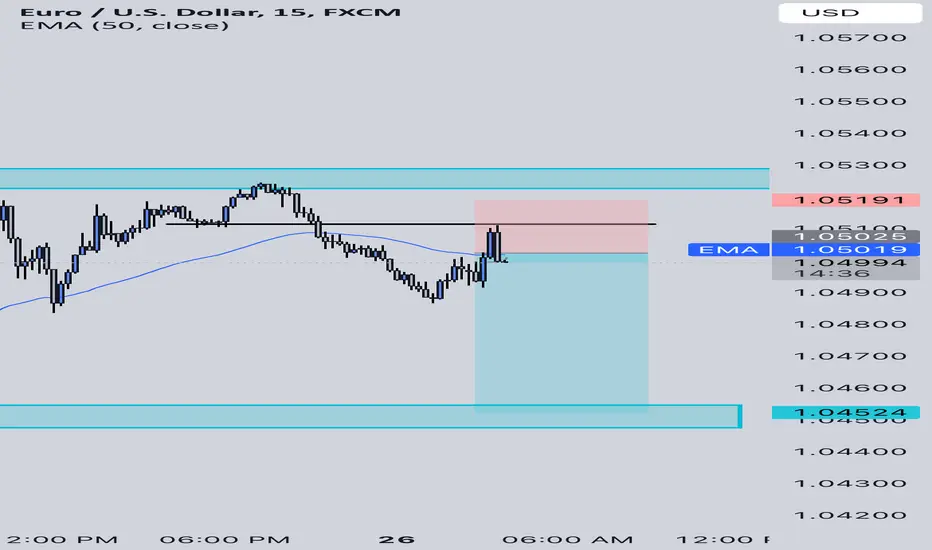
15m Chart Analysis
1️⃣
🔹Swing Bearish
🔹INT Bearish
🔹Swing Pullback
2️⃣
🔹Swing structure turned Bearish with confirmed BOS. And after BOS we expect PB phase to start.
🔹We didn’t mitigate any HP POI/Liq. to initiate the Swing PB phase.
🔹Will need a clear INT Structure shift to Bullish with momentum in order to play the PB phase otherwise price will continue Bearish till the sweep of Liq. on the 4H TF at 1.03730 and 1.03173 before tapping the clear 4H Demand.
3️⃣
🔹Expectations is set to continue Bearish with cautious from the Swing PB phase that can start at any time.
🔹Also keep in mind the End of Month Flows and PCE report today.

EURUSD INTRADAY sideways consolidation supported at 1.0425The EURUSD currency pair price action sentiment appears bullish, supported by the longer-term prevailing uptrend. The recent intraday price action appears to be a sideways consolidation towards the breakout level, previous resistance, and now a new support zone.
The key trading level is at 1.0425, which is the previous consolidation price range and rising trendline zone. A corrective pullback from the current levels and a bullish bounce back from the 1.0425 level could target the upside resistance at 1.0531 followed by the 1.0562 and 1.0617 levels over the longer timeframe.
Alternatively, a confirmed loss of the 1.0425 support and a daily close below that level would negate the bullish outlook opening the way for a further retracement and a retest of 1.0374 support level followed by 1.0350 and 1.0300.
This communication is for informational purposes only and should not be viewed as any form of recommendation as to a particular course of action or as investment advice. It is not intended as an offer or solicitation for the purchase or sale of any financial instrument or as an official confirmation of any transaction. Opinions, estimates and assumptions expressed herein are made as of the date of this communication and are subject to change without notice. This communication has been prepared based upon information, including market prices, data and other information, believed to be reliable; however, Trade Nation does not warrant its completeness or accuracy. All market prices and market data contained in or attached to this communication are indicative and subject to change without notice.

EURUSD ENTRY CHARTOn this pair, we are anticipating for a BUY CONTINUATION, as we expect the DXY to continue BEARISH, also the TREND on the EURUSD is still BULLISH from the HIGHER TF, and price is currently on a H4 Demand Zone, with our LTF Confirmation Met, we will be watching and waiting for Price to Tag us and we JOIN, UPDATE will be given in the SESSION BOX. THANK YOU


EURUSD 15MIN BUY BIASGood morning to you fellow traders, if you are seeing this early, it will help you confirm you trade ideas for EURUSD. the trend is a all time bears, but taking a pull back is what the moves i make. Once we get a BOS up there there will be a trace back to take out LIQ and push up more. go through the analysis I made and strategize and draw your conclusion


CHECK EURUSD ANALYSIS SIGNAL UPDATE > GO AND READ THE CAPTAINBaddy dears friends 👋🏼
(EURUSD) trading signals technical analysis satup👇🏼
I think now (EURUSD) ready for( BUY )trade ( EURUSD ) BUY zone
( TRADE SATUP) 👇🏼
ENTRY POINT (1.04750) to (1.04800) 📊
FIRST TP (1.04900)📊
2ND TARGET (1.05000) 📊
LAST TARGET (1.05150) 📊
STOP LOOS (1.04550)❌
Tachincal analysis satup
Fallow risk management

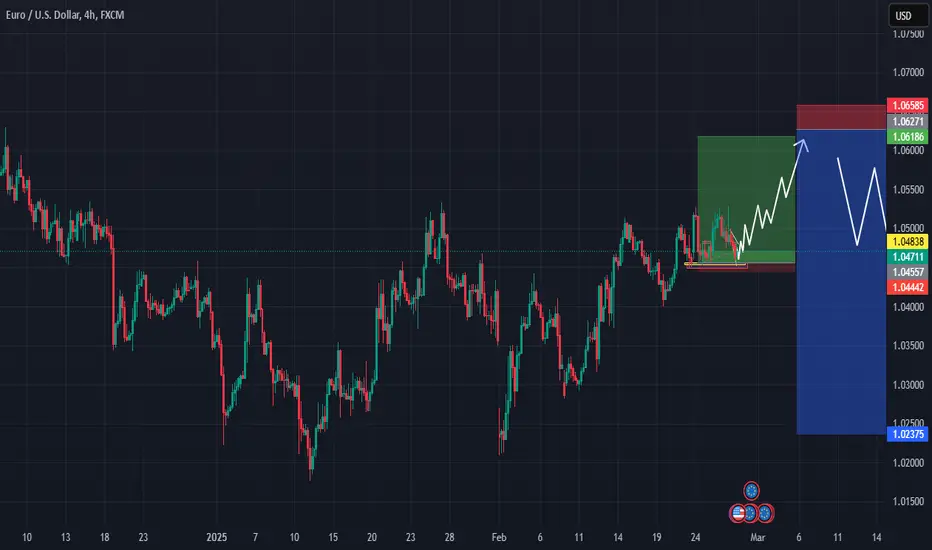
EUR/USD (Euro/US Dollar) daily timeframe with a bullish outlook.EUR/USD (Euro/US Dollar) daily timeframe with a bullish outlook.
Chart Analysis:
• The price is currently around 1.0467, showing signs of breaking above a key resistance zone (highlighted in red).
• A bullish scenario is illustrated, where the price is expected to retest the breakout zone and then continue upward.
• Key resistance levels are marked at 1.0680, 1.0791, and 1.0925, which could act as potential targets for a bullish move.
• The overall structure suggests a possible trend reversal after a downtrend, with a move towards higher levels.
Let me know if you need a deeper breakdown or specific details!


EURUSD in Focus After the Conservatives win the German ElectionEURUSD has traded as high as 1.0528 overnight after the Conservatives, led by Friedrich Merz won the German election.
Whether this move is capable of becoming something more than a relief rally response is likely to be determined by a number of factors, some of which are specific to Germany, including how quickly a new government can be formed, their approach to Ukraine, and perceived willingness to embrace removing the ‘debt break’, strict limits enshrined in German law after the 2008 financial crisis, to fund spending on much needed infrastructure.
Other factors likely to impact EURUSD this week include President Trump’s next moves on Ukraine and trade tariffs, as well as the release on Friday of the latest US PCE Index release, which is the Federal Reserve’s preferred gauge of inflation (1330 GMT Friday).
The Final Factor Relates to the Technicals.
Having posted a high at 1.0514 on February 14th 2025, EURUSD entered into a choppy trading period ahead of the weekends German elections. This likely reflected trader uncertainty ahead of what was potentially an important driver of future EURUSD price sentiment.
However, what this sideways activity has provided are several potentially important levels to monitor over coming sessions as we move into the new trading week. Closing breaks below support or above the resistance points, might offer clues to the potential direction of next EURUSD price moves.
Reaction to Election Results So Far…
The initial EURUSD price reaction to the election results saw EURUSD rally to challenge the first possible resistance offered by the February 14th high at 1.0514. This level has managed to cap attempts to move higher but traders may well be watching this level on a closing basis, as confirmed breaks above it might suggest a more sustained phase of price strength.
While a closing break of a previous failure price high can reflect potential for an improving technical picture, there is perhaps an even more important resistance band, we may also need to focus on.
Take a look at the above chart, there are 2 further failure highs near to today's price activity, which were posted on December 17th 2024 at 1.0534 and at 1.0533 on January 27th 2025. If possibilities of a more sustained phase of EURUSD price strength are to be seen, this 1.0533/34 area may be the one to watch on a closing basis.
While much will depend on future price trends, successful closing breaks above 1.0533/34 might be an indication that risks are turning towards a further attempt to push to higher levels.
What if 1.0533/34 Resistance Holds?
Having found EURUSD sellers previously at this 1.0533/34 level, it is just as possible they will be found again and even prove strong enough to hold and reverse current price strength. As such, we must also be aware of the support levels on the downside that if broken, may see a resumption of price weakness.
Last week’s low posted on February 19th at 1.0401, coincides with the 38.2% Fibonacci retracement of price strength seen in February, which stands at 1.0406.
These may well provide strong support on any dips in EURUSD prices, however if closing breaks of this support range were to develop, evidence may well be building for a more extended phase of price weakness.
The material provided here has not been prepared in accordance with legal requirements designed to promote the independence of investment research and as such is considered to be a marketing communication. Whilst it is not subject to any prohibition on dealing ahead of the dissemination of investment research, we will not seek to take any advantage before providing it to our clients.
Pepperstone doesn’t represent that the material provided here is accurate, current or complete, and therefore shouldn’t be relied upon as such. The information, whether from a third party or not, isn’t to be considered as a recommendation; or an offer to buy or sell; or the solicitation of an offer to buy or sell any security, financial product or instrument; or to participate in any particular trading strategy. It does not take into account readers’ financial situation or investment objectives. We advise any readers of this content to seek their own advice. Without the approval of Pepperstone, reproduction or redistribution of this information isn’t permitted.

Quick update The German elections went as expected, the next step is to form a viable coalition which is of course we'll have some ups and downs, but generally speaking I'm bullish on the euro for several reasons.
First of all, the biggest treat that Donald Trump will impose some kind of tariffs on the European Union is high but also the impact is not as severe as we anticipate. Well he can do it, as he wish but at the same time European Union also can hit hard, on the other hand if the Ukrain War will end, that will give a substantial boost for the European economy.
The USA is isn't in the situation where he can take several front trade Wars with everyone , without literally destroying their own economy. Just to bemore exact they cannot let that interest rates getting higher since it will directly affect the government interest payment on their future debts issuence which is already freakinghigh.
At least not now .
Inflation in the European Union is coming down which is also indicating that may the ECB have to cut once again the interest rate, that's that's not matter anymore because more or less it's already baked into the price, and we are already looking for the next cycle of red hikes, but until then this is a one-way Direction. It's up. Do you say it sooner or later will be forced also to lower the interest rates which gradually will take out the interest of the US dollar, hence the Euro again just getting another catalyst.
Price targe 1,0617-1,0650
DEEP buy 1,0375
FROM THE CURRENT LEVELS ONLY MODERATE BUYS. FOCUS IN PULLBACKS AND BIGGEN THAN -0,75%

Up for EUHi traders,
Last week EU started impulsive up as I've predicted in my outlook but it could not break the highs and on Wednesday it dropped.
Now it could be that this was a leading diagonal (orange wave 1) and price has now finished wave a (grey) of wave 2. In that case next week we could see a correction up and another impulse down to finish wave 2 (orange).
Or the last move is wave c (blue) of a bigger wave 4 of the leading diagonal and we could see another impulse wave up.
In both cases I expect a move up to minimal the 4H FVG (light blue box).
Let's see what the market does and react.
Trade idea: Wait for a change in orderflow to bullish and a small correction down on a lower timeframe to trade longs.
If you want to see more from my analysis, please make sure to follow me, give a boost or respectful comment.
This shared post is only my point of view on what could be the next move in this pair based on my analysis. If you don't agree, that's fine but I don't need to know it.
Don't be emotional, just trade!
Eduwave

EURUSD Triangle Breakout Setup
The price is forming an ascending triangle pattern, with a strong resistance level at the top and a rising trendline acting as support. A potential breakdown from this structure could lead to a bearish move.
Key Levels:
📌 Resistance: 1.0580
📌 Support: 1.0440
Expected Scenario:
🔻 A rejection from resistance followed by a break of the trendline could trigger a drop towards 1.0400 and lower.
🔻 Watch for confirmation before entering short positions.
Trading Plan:
✅ Wait for a clear breakout below the trendline.
✅ Look for bearish retest before shorting.
✅ Stop-loss: Above recent highs.
✅ Target: 1.0400 & below.
📉 Bearish Bias unless price breaks above resistance.