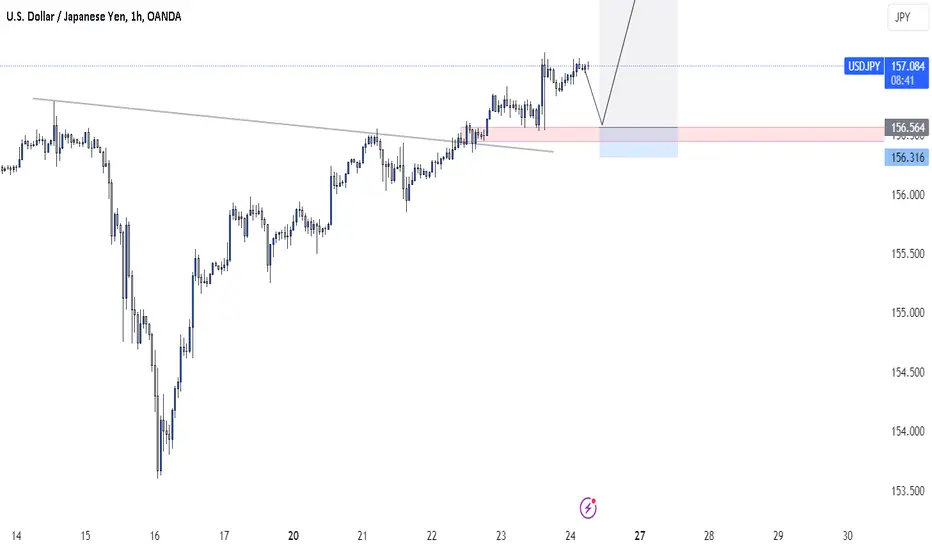
USDJPY - 24 May 2024Huge volume but price stop moving higher, this is a sign of short term high, while the low is formed weak, if supply take back control from here, we will most probably see price trade back down to the breaker, right below the SSL.
USDJPY.PRO.OTMS trade ideas

USDJPY : The buyers still prevail! The USD/JPY pair remained strong above the 157.00 level during Asian trading on Friday, consolidating previous gains despite ongoing risk aversion in the market. This pair benefited from weaker national CPI data from Japan, which pressured the Japanese Yen and supported USD/JPY.
The next key focus is on U.S. data, which will determine the pair's next direction. The outlook for further gains remains optimistic!

USDJPY - UniverseMetta - Analysis#USDJPY - UniverseMetta - Analysis
BUY from breaking through the 1st wave
The price can form a 3-wave structure along the trend and continue to rise to levels 165. It is also worth considering the range on H4 in which the price can remain for a long time, which increases the period of holding the position; you can also consider a correction from the upper border and increase purchases from the lower one.
For a downward movement, you should wait for consolidation at the lower border and a retest confirming further downward movement.
Target 160 - 165

USDJPY: Intraday Bullish Confirmation ?! 🇺🇸🇯🇵
USDJPY broke and closed above a key daily structure resistance.
Analysing an hourly time frame, I spotted a strong bullish confirmation
- breakout of a resistance line of a bullish flag pattern.
We see a positive bullish reaction to that after the release
of the yesterday's fundamentals.
I will expect growth to 157.5
❤️Please, support my work with like, thank you!❤️

USDJPY can go UP by Symmetrical Triangle➡️RR=3.68🏃♂️ USDJPY is moving in an Ascending Channel (in the Daily time frame ).
📈Regarding Classical Technical Analysis , USDJPY has succeeded in breaking the upper line of the Symmetrical Triangle Pattern .
🔔I expect USDJPY to continue its uptrend due to the breakout of the Symmetrical Triangle Pattern .
👑 Position :
USDJPY
Position: Long
Entry Point: 156.340 JPY (Stop Limit Order)
Stop Loss: 155.620 JPY
Take Profits: 158.987 JPY// 157.871JPY(RR=2.13)
Risk-To-Reward: 3.68
Please don't forget to follow capital management ⚠️
Please pay attention to the style of opening the position.⚠️
U.S.Dollar/Japanese Yen Analyze ( USDJPY ), 4-hour time frame⏰.
Do not forget to put Stop loss for your positions (For every position you want to open).
Please follow your strategy; this is just my idea, and I will gladly see your ideas in this post.
Please do not forget the ✅' like '✅ button 🙏😊 & Share it with your friends; thanks, and Trade safe.

USDJPY BUY SETUPThere is a likely intervention from BOJ today that will take us into a fresh demand zone, if it plays out, We would be buying USDJPY from that demand zone
USDJPYLooking for a sell opportunity in UJ.
waiting for the price push to the level of Resistance to make double top.
Use proper risk management.
Thank you

Potential bullish rise?USD/JPY has broken out of the pivot which has been identified as a pullback resistance and could potentially rise to the 1st resistance.
Pivot: 156.58
1st Support: 154.74
1st Resistance: 158.41
Risk Warning:
Trading Forex and CFDs carries a high level of risk to your capital and you should only trade with money you can afford to lose. Trading Forex and CFDs may not be suitable for all investors, so please ensure that you fully understand the risks involved and seek independent advice if necessary.
Disclaimer:
The above opinions given constitute general market commentary, and do not constitute the opinion or advice of IC Markets or any form of personal or investment advice.
Any opinions, news, research, analyses, prices, other information, or links to third-party sites contained on this website are provided on an "as-is" basis, are intended only to be informative, is not an advice nor a recommendation, nor research, or a record of our trading prices, or an offer of, or solicitation for a transaction in any financial instrument and thus should not be treated as such. The information provided does not involve any specific investment objectives, financial situation and needs of any specific person who may receive it. Please be aware, that past performance is not a reliable indicator of future performance and/or results. Past Performance or Forward-looking scenarios based upon the reasonable beliefs of the third-party provider are not a guarantee of future performance. Actual results may differ materially from those anticipated in forward-looking or past performance statements. IC Markets makes no representation or warranty and assumes no liability as to the accuracy or completeness of the information provided, nor any loss arising from any investment based on a recommendation, forecast or any information supplied by any third-party.

USDJPY (Nikkei Rises 0.7%, Driven by Banks and Energy Stocks) Nikkei Rises 0.7%, Driven by Banks and Energy Stocks
Japanese stocks closed higher, with gains led by the banking and energy sectors, as the 10-year Japanese government bond (JGB) yield hit an 11-year high. Mizuho Financial Group rose 3.1%, and Sumitomo Mitsui Trust Holdings climbed 2.4%, following a 3-basis-point increase in the 10-year JGB yield to 0.975%, the highest since May 2013. Energy stocks also performed well, with Eneos Holdings gaining 6.2% and Inpex up 4.2%. The Nikkei Stock Average increased by 0.7% to 39,069.68. Investors are closely watching developments in the Middle East and crude oil prices following the death of Iranian President Ebrahim Raisi in a helicopter crash on Sunday. The USD/JPY exchange rate is at 155.74, up from 155.67 late Friday in New York.
The price continues to experience bullish pressure towards 156.600, with a potential further rise to 157.970 upon breaking this level. A correction to 155.95 or 155.445 is possible before resuming the bullish trend. The bearish scenario will be triggered if the support line at 155.445 is broken, potentially leading to a drop to 154.700.
Pivot line: 155.950
Resistance line: 156.590, 157.970, 159.82
Support line: 155.450, 154.700, 153.685
The expected trading range is between support 155.450 and Resistance 156.600

USDJPYThis is what I see on pair, The current wave is wave 4 of and ending diagonal. targeting 148,73 blue box.

USD/JPY: Anticipating Heavy Bearish MovementHello Everyone,
The USD/JPY pair is once again testing the upper resistance levels. Despite the recent upswing in price, we anticipate a significant bearish movement soon that could surpass our initial bearish target.
TradeWithTheTrend3344

USDJPY Bullish Side Money heist Plan to Become RichMy Dear Robbers / Traders,
This is our master plan to Heist USDJPY Bank based on Thief Trading style Technical Analysis.. kindly please follow the plan I have mentioned in the chart. Our target is Red Zone that is High risk Dangerous Level, market is overbought / Consolidation / Trend Reversal at the level Bearish Robbers / Traders gain the strength. Be safe and be careful and Be rich.
Note: If you've got a lot of money you can get out right away otherwise you can join with a swing trade robbers and continue the heist plan,
Loot and escape on the target 🎯 Swing Traders Plz Book the partial sum of money Use Trailing Stop To Protect Looted Money and wait for next breakout of dynamic level / Order Block, Once it is cleared we can continue our heist plan to next new target it will update after the Breakouts.
support our robbery plan we can easily make money & take money 💰💵 Join your hands with US. Loot Everything in this market everyday.

USDJPY - SELL @ 156.716 - Expecting retracement Sell order placed @ 156.716 - 4HR shows signs of a possible retracement.
Order placed @ 16:08.24EST - Looking to hold until 9:00pm latest.
T/P @ 155.710

USD/JPY steady as Japanese PMIs mixedThe Japanese yen is slightly lower on Thursday. USD/JPY is trading at 156.70, down 0.08% on the day at the time of writing.
Japan’s PMIs for April were a mixed bag and the yen didn’t show much reaction. Services PMI dipped to 53.6, down from 54.3 in March and just shy of the forecast of 53.8. This was the smallest growth in services since February.
Manufacturing PMI showed improvement and rose to 50.5, up from 49.6 in March and above the market estimate of 49.7. This was the first growth since May 2023 as manufacturing has been in a prolonged slump. The 50 level separates contraction from growth.
The Japanese economy is showing signs of improving after first-quarter GDP declined. Inflation has been easing, which could hamper the ability of the Bank of Japan to increase rates without reigniting deflation.
With inflation falling around the globe, major central banks have been under pressure to lower interest rates. The central banks remain cautious, however, and the Fed minutes indicated that there was a discussion to raise rates at the May 1st meeting. Other central banks are also unclear about their rate path – the Reserve Banks of Australia and New Zealand held rates at their most recent meetings but also considered hiking rates.
The FOMC minutes noted that policy makers are not confident about lowering rates at this stage and want to see more evidence that inflation will continue to drop and remain sustainable around the 2% target. This message is consistent with what we have been hearing from a host of Fed members, although the markets have priced in a September rate cut.
USD/JPY tested support at 156.02 earlier. Below, there is support at 156.33
157.07 and 157.32 are the next resistance lines

Usdjpy buyUsdjpy pair looking for buy continues pattern further upside expecting let take long side if fall crucial take one more layer buy


USDJPY H4 | Bearish Drop Based on the H4 chart analysis, we can see that the price has just reacted off our sell entry at 156.93, which is a swing high resistance.
Our take profit will be at 154.60, a pullback support level close to 78.6% Fibo retracememt
The stop loss will be placed at 158.00, which is a swing-high resistance level.
High Risk Investment Warning
Trading Forex/CFDs on margin carries a high level of risk and may not be suitable for all investors. Leverage can work against you.
Stratos Markets Limited (www.fxcm.com):
CFDs are complex instruments and come with a high risk of losing money rapidly due to leverage. 68% of retail investor accounts lose money when trading CFDs with this provider. You should consider whether you understand how CFDs work and whether you can afford to take the high risk of losing your money.
Stratos Europe Ltd, previously FXCM EU Ltd (www.fxcm.com):
CFDs are complex instruments and come with a high risk of losing money rapidly due to leverage. 70% of retail investor accounts lose money when trading CFDs with this provider. You should consider whether you understand how CFDs work and whether you can afford to take the high risk of losing your money.
Stratos Trading Pty. Limited (www.fxcm.com):
Trading FX/CFDs carries significant risks. FXCM AU (AFSL 309763), please read the Financial Services Guide, Product Disclosure Statement, Target Market Determination and Terms of Business at www.fxcm.com
Stratos Global LLC (www.fxcm.com):
Losses can exceed deposits.
Please be advised that the information presented on TradingView is provided to FXCM (‘Company’, ‘we’) by a third-party provider (‘TFA Global Pte Ltd’). Please be reminded that you are solely responsible for the trading decisions on your account. There is a very high degree of risk involved in trading. Any information and/or content is intended entirely for research, educational and informational purposes only and does not constitute investment or consultation advice or investment strategy. The information is not tailored to the investment needs of any specific person and therefore does not involve a consideration of any of the investment objectives, financial situation or needs of any viewer that may receive it. Kindly also note that past performance is not a reliable indicator of future results. Actual results may differ materially from those anticipated in forward-looking or past performance statements. We assume no liability as to the accuracy or completeness of any of the information and/or content provided herein and the Company cannot be held responsible for any omission, mistake nor for any loss or damage including without limitation to any loss of profit which may arise from reliance on any information supplied by TFA Global Pte Ltd.
The speaker(s) is neither an employee, agent nor representative of FXCM and is therefore acting independently. The opinions given are their own, constitute general market commentary, and do not constitute the opinion or advice of FXCM or any form of personal or investment advice. FXCM neither endorses nor guarantees offerings of third party speakers, nor is FXCM responsible for the content, veracity or opinions of third-party speakers, presenters or participants.

USDJPY is in a well-defined bullish trend📈☝️USDJPY is in a well-defined bullish trend📈☝️
After the price broke out of the first zone, we can see that USDJPY continues to rise more.
The upward move is only related to the fact that the BOJ is not taking further steps to support its currency and economy as well.
As long as the BOJ will be in silent mode, there is no reason for the USDJPY to move lower.
📺You may watch the video for further details📺
Thank you and Good Luck!
❤️PS: Please support with a like or comment if you find this analysis useful for your trading day❤️

💡 USDJPY: Analysis May 23USDJPY has invalidated the doji signal and continued to increase in the past session. It has now approached the previous peak at 156.7, but has not yet shown a breakout signal. This price behavior is detrimental to our current selling strategy, but we still do not encourage you to change tactics because the risk of exchange rate intervention from the BoJ is still present and the price has not yet reached its peak. than. Brothers continue to hold existing short positions, SL placed above level 156.7. In case the price continues to go up and breaks this barrier, you should temporarily stop trading and wait for new signals.
💡 H1 trend: Sideway
Today trading idea: Sell.

Strifor || USDJPY-22/05/2024Preferred direction: SELL
Comment: The opinion and trading setup for the Japanese yen also remains the same. In the short term, all this will most likely be a small, but downward movement towards levels 153 and 152 . The two previous scenarios are relevant for today, as already mentioned. Scenario №1 - sales at current prices, and scenario №2 - a preliminary approach to 157-158. In both cases, we fix the target near the level of 153.222 (70%), and at the level of 151.786 (the remaining part).
Additional comments on this trade will be provided as situation changes. Follow us!
Thank you for like and share your views!

USDJPY May 22, 2024 Will the rising wave continue?Hello everyone, DEEKOP is ready to bring the most accurate signals and assessments to everyone.
Financial freedom is true freedom.
Looking at the H1 chart with the current wave counting method we see
The correction process has formed 3 waves abc
- Currently, the price continues to increase following the trend of large wave 3
- We have the main confirmation threshold at 156,554, this is the confirmation area that the temporary adjustment process has ended.
- Once the price maintains above the 156.554 area, the price will develop very quickly because wave 3 moves quickly and sharply.
Note: Sufficient TP, SL to be safe and win the market‼ ️Change data plan will be updated later.
Deekop's analysis is only a personal opinion with a desire to share its views with the community. I'm not always right. But my analysis always reflects my meticulous evaluation of what is best for an investment.

USDJPYLooking for a sell opportunity in UJ.
Reason to sell:
Possibility to make Head and Shoulder pattern in 15 minute TF.
Use proper risk management.
Thank you
USDJPY remains high near 157,000The USD/JPY pair reversed its recent gains, reaching a two-week high near 157.00 during the Asian trading session on Thursday. The pair briefly tested the 157.00 level amidst steady bond-buying activity by the Bank of Japan (BoJ). However, a pause in the US Dollar's recovery and a slowdown in US Treasury yields have pulled the pair lower.
Despite this, USD/JPY remains in an uptrend across all timeframes, and as the saying goes, "the trend is your friend." This suggests that the pair may ultimately benefit from this pullback, even if it encounters resistance at the aforementioned level.
