All-Time Low and All-Time High Trading StrategiesAll-Time Low and All-Time High Trading Strategies
In the volatile world of trading, mastering all-time high trading strategies and understanding how to navigate all-time lows are key. This FXOpen article delves into the nuanced tactics and insights that may help you navigate the peaks and troughs of market conditions, offering comprehensive insights if you are looking to leverage these critical areas for trading opportunities.
Understanding All-Time High and All-Time Low Market Conditions
Understanding the dynamics of all-time high and all-time low market conditions is crucial for traders aiming to navigate these pivotal points effectively.
All-time low trading refers to the scenario where an asset has reached its lowest price level in history, often triggering a heightened interest among investors looking for undervalued opportunities or signalling a potential reversal point. Conversely, all-time high trading occurs when assets are trading at their highest historical prices, indicating strong market optimism or potentially overvalued conditions ripe for a correction.
These extremes in market conditions represent significant psychological thresholds for the market participants, as they may lead to increased volatility and liquidity. Traders scrutinise trading at all-time lows to identify the potential for recovery, while those at all-time highs are monitored for signs of sustained momentum or impending pullbacks.
Below, we cover three all-time high and low trading strategies. Consider applying them to live charts in FXOpen’s free TickTrader platform.
Breakout and Consolidation Strategy
When engaging with the market, traders often explore the dynamics of stocks trading at all-time highs or nearing all-time lows. This approach is anchored in the principle that these assets can exhibit significant momentum, potentially setting the stage for trading opportunities.
In learning how to trade all-time-high stocks, one strategy stands out: the Breakout and Consolidation strategy. Its essence lies in monitoring assets that are not only at their all-time high or low but also exhibit a distinct consolidation pattern post-reaching these levels.
Traders typically look for the price to close beyond the all-time high or low, usually on timeframes ranging from 1 hour to daily charts. A subsequent period of sideways movement just beyond the high or low signals a consolidation phase. This phase is crucial as it suggests a potential accumulation or distribution, with traders able to potentially capitalise on a further breakout or upcoming reversal.
Entry
Traders may place a buy-stop order just above the high of the consolidation range if anticipating a continuation of the uptrend.
Alternatively, a sell-stop order can be set just below the low of the range for those expecting a downtrend.
Stop Loss
A stop loss is typically positioned on the opposite side of the consolidation range to manage risk effectively.
Take Profit
Given the absence of a predefined exit point, traders often rely on a specific risk/reward ratio to determine when to exit the position.
Others may prefer using technical analysis tools, such as Fibonacci extensions or momentum-based indicators, to identify potential exit points.
Breakout Retest Strategy
The Breakout Retest strategy offers a nuanced approach for traders looking to understand how to trade all-time high forex pairs. This method is favoured by traders who seek to capitalise on the momentum immediately following the breach of an all-time high or low without waiting for a consolidation phase to confirm the breakout.
In this strategy, the initial step involves identifying a decisive break of the all-time high or low. Unlike the Breakout and Consolidation strategy, which requires a period of sideways movement for confirmation, the Breakout Retest strategy allows traders to act swiftly.
Upon witnessing the break, traders can place an order directly at the level of the broken high or low. This newly established level is now expected to serve as a foundation of support or resistance, guiding future price actions.
Entry
An order may be set at the broken high or low, anticipating it to now act as support (in case of a high break) or resistance (in case of a low break).
Stop Loss
A stop loss may be strategically placed beyond a nearby swing point, offering enough leeway for the price to fluctuate slightly before potentially moving in the anticipated direction.
Take Profit
Profit-taking may be based on a predetermined risk/reward ratio that aligns with the trader's objectives.
Alternatively, traders may employ technical indicators as a signal for exiting the trade.
Candlestick Pattern Reversal Strategy
A Candlestick Pattern Reversal may be particularly effective as part of an all-time low trading strategy. This technique hinges on the premise that a significant price level, such as an all-time low, may mark a turning point where selling pressure exhausts and buying interest begins to dominate. By focusing on candlestick patterns that signal a reversal, traders can identify moments when the market sentiment shifts from bearish to bullish.
The theory states that it’s best to use higher timeframes here, like the daily or weekly chart. Traders watch for specific candlestick formations that indicate a potential reversal. The hammer or morning star patterns are key figures in this analysis, suggesting that sellers have capitulated and buyers are starting to take control.
Once such a candle closes, traders have the option to enter the trade at the closing price or at the opening of the next. Another approach is to wait for a breakout beyond the high or low of the identifying candlestick for confirmation.
Entry
Traders may initiate a position at the close of the reversal candle or upon a breakout of the candle's high or low.
Stop Loss
Setting a stop loss just beyond the extremities of the reversal candle may help in managing risk. Traders consider the risk/reward ratio as they trade on high timeframes, so price fluctuations may be significant.
Take Profit
As this is a reversal strategy aimed at capitalising on a shift in market dynamics, identifying notable support or resistance levels may provide logical targets for exiting the trade.
Evaluating Fundamentals Around All-Time Highs and Lows
Navigating the terrain of all-time highs and lows in both forex and stock markets demands a keen understanding of fundamental analysis. This approach enables traders to assess an asset's intrinsic value and anticipate future movements.
Economic Indicators: For forex, interest rates, inflation, and employment data can help set a bias. In stocks, understanding earnings reports, industry health, and economic conditions can be valuable in analysing direction.
Market Sentiment: Investor sentiment and market trends can significantly impact prices at extreme levels.
Global Events: Political events, economic policies, and global crises can influence market movements, especially at pivotal highs and lows.
Financial News: It may be a good idea to stay updated with financial news and reports that can affect asset valuations and investor behaviour.
The Bottom Line
Mastering how to trade all-time lows and highs is essential for any trader looking to navigate market extremes effectively. By applying the strategies outlined, traders can potentially capitalise on the opportunities these highs and lows present. For those ready to apply these insights in real-world trading scenarios, opening an FXOpen account offers a gateway to the markets, providing the tools and platforms necessary for engaging with all-time high and low trading strategies.
This article represents the opinion of the Companies operating under the FXOpen brand only. It is not to be construed as an offer, solicitation, or recommendation with respect to products and services provided by the Companies operating under the FXOpen brand, nor is it to be considered financial advice.
U.S. Dollar / Mexican Peso
18.91961MXNR
+0.01306+0.07%
As of today at 14:47 GMT
MXN
No trades
USDMXN trade ideas

Fed keeps rates steady, Banxico up next The US Federal Reserve has kept interest rates steady at 5.25%-5.50% while continuing its balance sheet reduction as planned since May 2023.
In contrast, the Bank of Mexico (Banxico) might announce a rate cut tomorrow.
It's anticipated that Banxico could decrease its interest rate from 11.25% to 11%, potentially applying pressure on the Mexican peso. This could drive the USD/MXN rate closer to the 17.00 mark, diverging further from its 10-year low. Some Fib levels from its recent swing higher could also be some interesting, more assessable, targets
However, the possibility of a rate cut from Banxico is not guaranteed, given potential divisions within its Governing Council. Recent speeches by officials indicate a 3-2 split, with some members leaning towards a more accommodative approach, while others like Jonathan Heath and Irene Espinosa Cantellano favor a hawkish stance.


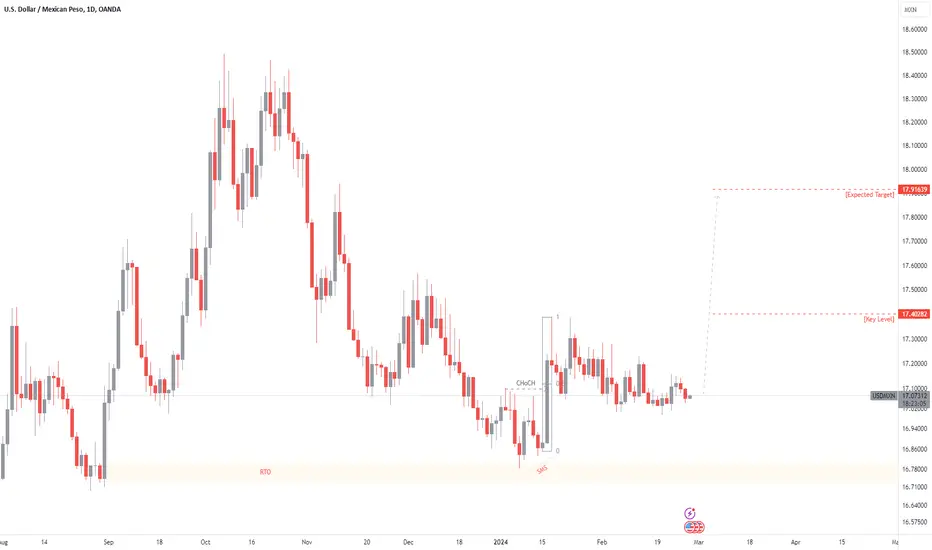
Strong downtrendUSDMXN has been under pressure for a few days now and I am not expecting it to stop soon. The US Dollar has been going down because of expected rates cuts to come this year and the mexican peso still benefits from a tighter monetary policy. Now that the fundamentals are in the favor of a continuation to the downside, we can observe on the daily timeframe the formation of a triangle that has been broken to the downside showing that sellers are in control and that they will probably continue to put more volume pushing price down in the future.

USDMXN Bearish BreakoutUSDMXN has had difficulties creating higher structure while slowy going down on every failed attempt to break higher. Price has recently broken below a key support which shows that sellers are in control especially knowing the macro economics circumstances. My target is at 16.82000 .


USDMXN | Market outlookThe latest data from the U.S. Commodity Futures Trading Commission and LSEG indicates a decrease in speculators' net short positions on the U.S. dollar, coinciding with the greenback's rebound amid reduced expectations of Federal Reserve easing in March. The value of net short dollar positions fell to $9.799 billion, down from $12.7 billion the previous week, marking the largest decline since August. Speculative sentiment toward the dollar shifted notably, with a significant decrease in net euro longs. Institutional investors also decreased their significant shorts on the dollar, while leveraged accounts or hedge funds reduced net dollar longs. The dollar is set for a second consecutive weekly gain of 0.8%, supported by solid U.S. economic data and statements from Fed officials indicating a tempered outlook for rate cuts in the near term. Market expectations of a rate cut at the March meeting have decreased to less than 50%, compared to 80% the previous week. For 2024, futures traders anticipate five rate cuts of 25 basis points each, down from expectations of six cuts last week. Overall, the data reflects a more stable sentiment toward the U.S. dollar, with investors adjusting their positions in response to evolving economic and monetary policy expectations.

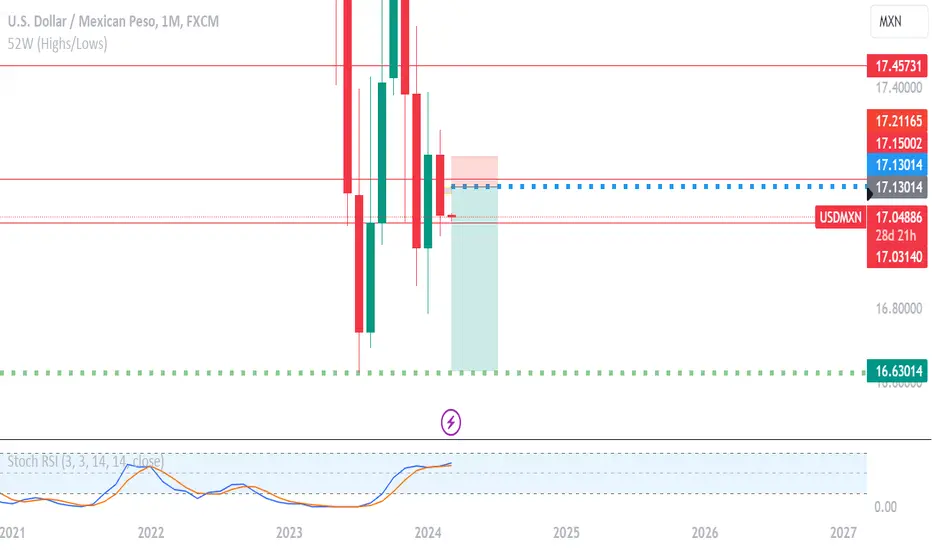
USDMXN Consolidation before strong decline.The USDMXN pair gave us the most optimal sell signal on our last analysis (October 09 2023) and after hitting our 17.0500 target, is consolidating:
This consolidation is on 1D RSI terms, similar to September 28 - October 28 2022, when the RSI Triangle broke downwards and with that, the price was detached from the 1D MA50 (blue trend-line) and aggressively declined to marginally over the -0.236 Fibonacci extension. As a result, we are taking now another sell with our Target at 16.200 (Fibonacci -0.236).
-------------------------------------------------------------------------------
** Please LIKE 👍, FOLLOW ✅, SHARE 🙌 and COMMENT ✍ if you enjoy this idea! Also share your ideas and charts in the comments section below! This is best way to keep it relevant, support us, keep the content here free and allow the idea to reach as many people as possible. **
-------------------------------------------------------------------------------
💸💸💸💸💸💸
👇 👇 👇 👇 👇 👇


Long in USDMXNI have initiated a long position in the USDMXN forex market as the price has reached a significant demand zone. This trade decision is backed by a comprehensive analysis of market conditions, where I have identified key technical indicators and chart patterns that suggest a high probability of an upward movement.
The USDMXN pair has shown a clear bounce off the demand zone, indicating a strong potential for a bullish trend reversal. Additionally, the convergence of multiple factors, such as a bullish divergence in the oscillators, a break of a key resistance level, and a bullish candlestick formation, further reinforces the trade setup.
With a well-defined risk management strategy in place, I will closely monitor the trade, adjusting stop-loss and take-profit levels as necessary. By sticking to a disciplined approach and staying informed about market news and economic events, I am confident in my ability to successfully navigate this long position in the USDMXN forex market and capitalize on potential upward price movement.

Shot in USDMXNI have entered a short position in the USDMXN forex market as the price has touched a significant supply zone. This trade decision is based on a meticulous analysis of market conditions, where I have identified key indicators and patterns that indicate a potential downward movement. By strategically executing this trade, I aim to capitalize on this favorable opportunity, leveraging my expertise in trading to navigate the market with precision and achieve optimal results.
The USDMXN pair has shown a clear rejection at the supply zone, indicating a potential reversal in the price action. Furthermore, the confluence of technical factors, such as Fibonacci retracement levels, trendline resistance, and bearish candlestick patterns, adds further weight to the trade setup.
With a comprehensive risk management plan in place, I will closely monitor the trade, adjusting stop-loss and take-profit levels as necessary to maximize potential gains while minimizing potential losses. By adhering to a disciplined trading strategy and staying abreast of market developments, I am confident in my ability to successfully navigate this short position in the USDMXN forex market.


