SPX500 – Consolidation Between 5966–5990, Breakout to Set DirectSPX500 | Technical View
The price is currently consolidating between 5966 and 5990.
A 1H or 4H candle close below 5966 would confirm bearish momentum, with downside targets at 5938 and 5905.
However, as long as price trades above 5966, the outlook remains bullish, targeting 5990.
A 1H close above 5990 may extend the move toward 6010 and 6030.
Resistance: 5990, 6010, 6030
Support: 5938, 5905, 5858
USSP500CFD trade ideas

SPX500 BUYGreeting there traders this is my analysis on
📊 S&P 500 – Potential Elliott Wave 3 Formation | Long Setup
The current 4H chart of the S&P 500 suggests a potential bullish continuation based on Elliott Wave Theory. Here's the structured breakdown:
🔹 Wave 1: Initiated after a failed breakout and sharp reversal from a previous resistance zone. This impulsive move marked a key shift in trend structure.
🔹 Wave 2: A corrective phase followed, consolidating near the support area (~5,915), respecting previous demand.
🔹 Current Price Action: Price has broken above the minor resistance at 6,000, indicating the potential beginning of Wave 3, which is typically the strongest and most extended wave in the sequence.
📈 Trade Setup:
Entry: Above 6,000 (confirmation of breakout and wave continuation)
Stop Loss: Below 5,915 (invalidates bullish structure if broken)
Target Zone: 6,167 – 6,170 (aligned with prior resistance and wave projection)
🔍 Additional Notes:
The breakout is supported by a clean structure and rejection from key support.
Ideal scenario would involve increasing volume and continuation with higher highs and higher lows.
📌 Bias: Bullish – targeting Wave 3 extension.
⚠️ Always manage risk accordingly and watch for signs of exhaustion or divergence.
Dear Traders like,comment let me know what do you think?

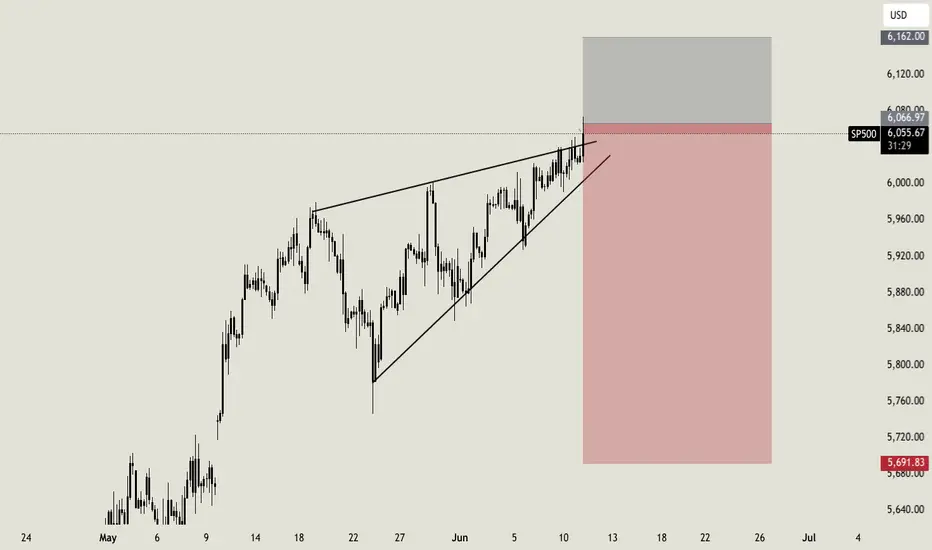
S&P500 Index (US500): Bullish Accumulation Pattern
I spotted a nice example of an ascending triangle pattern on a daily time frame.
To confirm a bullish continuation, we will need a bullish breakout
of its neckline.
A daily candle close above 5996 will provide a reliable confirmation.
A rise will be anticipated at least to 6080 resistance then.
❤️Please, support my work with like, thank you!❤️
I am part of Trade Nation's Influencer program and receive a monthly fee for using their TradingView charts in my analysis.

S&P500 finishing re-accumulation and sets eyes on 6230.The S&P500 / SPX has turned sideways after an impressive recovery from April's lows.
The 1day MA50 provides the same kind of support as it did after the October 2023 rebound.
The RSI pattern on both sequences is also similar and it suggests that the price is at the point where it breaks upwards to the Rising Resistance.
Target 6230.
Follow us, like the idea and leave a comment below!!

up or down...Hello friends🙌
🔊As you can see, the US500 index has been identified with several resistance encounters and the good support that the price has been able to break the resistance and turn it into support. Now, according to today's news, it seems that the price is targeting higher targets that we have identified for you.
In case of correction, it has strong support ahead of it, which we have identified with a white line, but don't forget that buyers have entered...📈
🔥Join us for more signals🔥
Trade safely with us.

A little more upside for SPX500USDHi traders,
And again my previous outlook of SPX500USD played out as I've said. After a small correction we saw the continuation of the upmove to the Daily FVG.
Next week we could see price come into the Daily FVG and reject from there for a correction down.
Let's see what the market does and react.
Trade idea: Wait for a small correction down on a lower timeframe to trade short term longs into the Daily FVG.
If you want to learn more about trading FVG's & liquidity sweeps with Wave analysis, then please make sure to follow me.
This shared post is only my point of view on what could be the next move in this pair based on my technical analysis.
Don't be emotional, just trade your plan!
Eduwave

SPX500 Holds Steady as Markets Eye US-China Trade Developments SPX500 Overview
U.S. stock futures were little changed on Tuesday as investors awaited key developments from the U.S.-China trade talks underway in London.
Technical Outlook (4H Chart):
The index is experiencing cautious movement amid ongoing tariff tensions and geopolitical uncertainties.
Bullish Scenario:
A sustained 4H close above 6030 could confirm bullish momentum, with upside targets at 6066 and 6098, potentially extending toward a new all-time high (ATH).
Bearish Scenario:
As long as the price remains below 6010, bearish momentum may persist, targeting the support levels at 5966, followed by 5938 and 5902.
Support: 5966 • 5938 • 5902
Resistance: 6066 • 6098


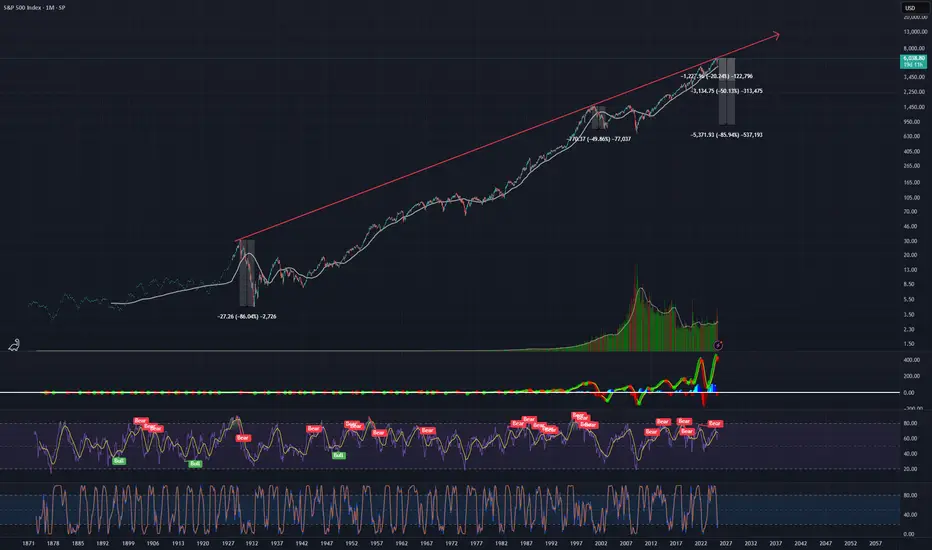
SPX 500 to 17,000 in 7 years.This chart represents the S&P 500, showcasing its performance over time, including quarterly data.
It captures everything.
Every recession.
Every war.
Every president.
Every variation of the monetary base as superpowers rise and fall.
Whenever I hear a bear in the stock market declare that THE TOP has been reached, and we are about to CRASH -50% to -90%
I find myself drawn to these comprehensive long term charts.
If the bulls are genuinely in control and we have merely undergone an intermediate-term correction, then the long-term bull market that commenced at the 2009 low remains robust, with many more years ahead.
The chart also illustrates that the three significant bull market phases typically last around 18-20 years following a major breakout.
And they yield a comparable number of X's.
It's all quite fascinating, if you ask me.
See you in the future!

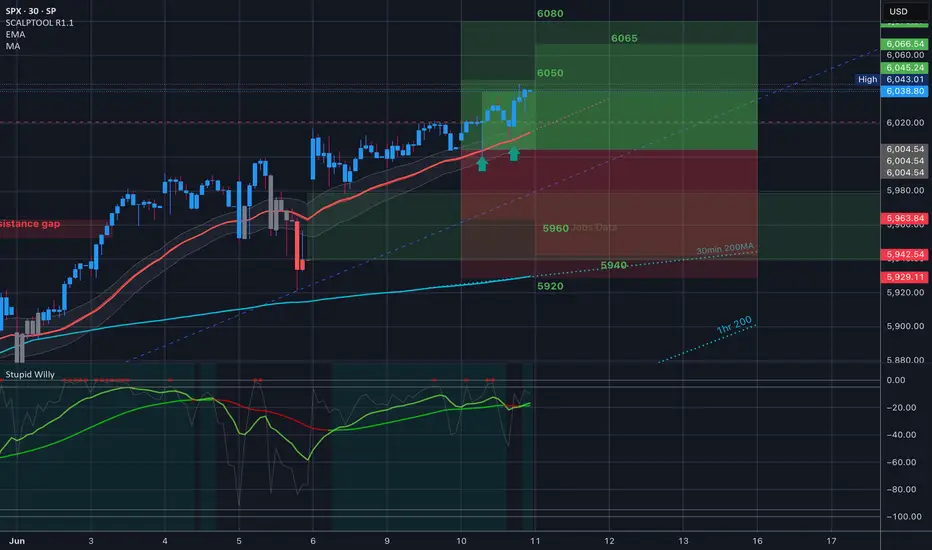
06/02 Weekly GEX Analysis - 6000 Looks EasyThe biggest event last week was undoubtedly the court ruling involving Trump. The market responded with optimism, and on Thursday premarket, SPX surged toward the 6000 level — only to get instantly rejected. That strong rejection suggests this is a firm resistance zone.
From the GEX expiry matrix, it's clear that the market is hedging upward for this week, but downward for next week. To me, this indicates that while the near-term GEX sentiment remains slightly bullish, the market may be preparing for a pullback or retest in the medium term.
This week, SPX has already entered a GEX zone surrounded by positive strikes — up to around the 6000 level. That makes 6000 an “easy target” for bulls, and we’ll likely see profit-taking here, just like we did last Thursday premarket.
⚠️ However, if we look more closely at the weekly net open interest:
...we can see a strong bullish net OI build-up starting to emerge around the 6100 level — a price zone that currently feels distant and even unreachable. But if the 6000 resistance breaks, we could see a fast gamma-driven squeeze up to 6050 and possibly 6100 before the next wave of profit-taking kicks in.
As is often the case during bullish moves, the market seems blind to the bigger picture — no one’s looking down, only up. The mood is greedy, and momentum favors the bulls... for now.
Never underestimate FOMO — but also never underestimate Trump. He’s unlikely to accept the court’s decision on tariffs quietly. Any new negative headline could shake the market, no matter where price is sitting…

S&P500 awaits Trade Balance and Jobless Claims figuresTrump Tightens Immigration: Bans people from 12 countries, limits entry from 7 more, and blocks foreign students from attending Harvard.
Russia-Ukraine Tensions: Putin plans to strike back after a Ukrainian drone attack. Trump says Russia’s allies won’t profit from rebuilding Ukraine.
UK Housing Boom: Home sales rose 6% in May, the strongest in 3+ years, despite the end of a buyer tax break.
Germany & U.S.: German politician Friedrich Merz meets Trump today. At home, Germany faces rising public concern about tough economic times.
ECB Rate Cut Likely: The European Central Bank is expected to cut rates by 0.25% to 2%, but may slow further cuts soon.
Key Support and Resistance Levels
Key trading leel is at: 6000
Resistance Level 1: 6090
Resistance Level 2: 6140
Resistance Level 3: 6200
Support Level 1: 5900
Support Level 2: 5845
Support Level 3: 5800
This communication is for informational purposes only and should not be viewed as any form of recommendation as to a particular course of action or as investment advice. It is not intended as an offer or solicitation for the purchase or sale of any financial instrument or as an official confirmation of any transaction. Opinions, estimates and assumptions expressed herein are made as of the date of this communication and are subject to change without notice. This communication has been prepared based upon information, including market prices, data and other information, believed to be reliable; however, Trade Nation does not warrant its completeness or accuracy. All market prices and market data contained in or attached to this communication are indicative and subject to change without notice.

Smart Money Levels Spotted on SPX500USD – Massive Sell Zone Major Supply Zone (Resistance): 🔵 6,000 – 6,050
Price is currently sitting right inside a well-defined supply zone, where smart money previously sold off heavily back in December.
Intermediate Support: 🔵 5,436
A clear structural level where price previously broke down from and retested in April.
Major Demand Zone (Support): 🟠 4,900 – 5,000
Price reacted aggressively from this zone during the massive April sell-off, suggesting strong institutional interest.
---
🧭 Current Price Action:
SPX500USD is currently trading at 6,004, right at the supply zone marked by the blue shaded area. Price has aggressively rallied from the 4,900 demand zone in April and is now testing this critical resistance level for the first time since the major drop.
📌 Notice the tight consolidation and rejection wicks from this area in the past. This could signal a potential reversal or a breakout trap!
---
⚠️ Bearish Signals to Consider:
🔻 Risk of Rejection: With price inside a supply zone and momentum slowing, there’s a high probability of a rejection.
🔻 Double Top Structure: Previous highs around 6,050 could form a double top, making this a textbook reversal opportunity.
🔻 Downside Targets:
📍 First target: 5,436 (previous support & breakout level)
📍 Second target: 4,900–4,950 (major demand zone & value area)
---
🧠 Smart Money Perspective:
This setup aligns perfectly with institutional trading logic:
Sell high in supply zones
Buy low in demand zones
Volume Profile and LuxAlgo’s visible range confirm these key levels where institutions are most likely to act.
---
🧨 Trading Plan:
🚫 No buying in the supply zone
📉 Short entries if rejection confirms (look for bearish engulfing / lower high on lower timeframes)
🎯 Target 1: 5,436
🎯 Target 2: 4,900–4,950
🛡️ Stop Loss: Above 6,050 (fake breakout zone)
---
📊 Bonus Tip:
Watch how price behaves around FOMC and CPI news – liquidity grabs often happen right before key macro data, especially near supply zones. Be patient!
---
💬 Let’s Discuss:
Do you see a breakout or a rejection from here?
Comment below if you're bullish or bearish on SPX500USD! 👇
Don't forget to like & follow if you find this breakdown helpful 💡
#SP500 #SPX500USD #SmartMoney #SupplyAndDemand #TechnicalAnalysis #PriceAction #LuxAlgo #TradingSetup #SwingTrade #BearishReversal

S&P500: Gearing up for a push to 6,100S&P500 is bullish on its 1D technical outlook (RSI = 64.611, MACD = 85.830, ADX = 19.630) as it has been trading inside a Channel Up for over a month. Right now it is halfway through the new bullish wave. We expect it to rise by at least +4.40%, same as the previous one. Stay bullish as long as the 4H MA50 holds, TP = 6,100.
## If you like our free content follow our profile to get more daily ideas. ##
## Comments and likes are greatly appreciated. ##


Morning market ideasSPX could be finished overnight but the cash session may try to equal the overnight high. Gold is coming up to heavy resistance. Oil Looks to be heading towards 66 and maybe more. BTC looks like it may drop again but right now it's at support. Natural Gas is likely going to drop.

The close - no bells ring at a topMy feeling right now is one of deja vu. Like the bottom before the president delayed tariffs, there was no volume and my assumption was we would go a bit lower. Here we have no volume and my assumption has been we will go a bit higher. Could we top here? It's possible. The bear divergences are pointing to a move down at least temporarily.

SPX Danger ZoneLog chart of SPX with a trendline connecting 1929 top to 2000 dot com top and up to 2024-25 top.
We already touched this trendline multiple times at the end of 2024 and the beggining of 2025, after which we saw a 20ish percent pullback.
If history rhymes, then we can expect a top at 6250-6350 area in the next few months and we might even stay around there for some time trapping retail investors and other foverever bulls. However, the crash ranging beteween 50 percent (2000 dot com bubble burst) and 86 percent (1929 Wall Street crash) might unravel over the next few years.
With the amount of leverage in the market this house of cards can tumble down even quicker.
Take care.


S&P 500 Daily Chart Analysis For Week of June 6, 2025Technical Analysis and Outlook:
The S&P 500 Index has demonstrated an upward trajectory during this week's trading session, surpassing the established Outer Index Rally level of 5955 and the Key Resistance level of 5965. Currently, the index is exhibiting a bullish trend, with a focus on the Outer Index Dip target, set at 6073. Furthermore, additional critical levels have been identified, including Key Resistance at 6150 and the Next Outer Index Rally at 6235. Conversely, there is a potential decline in index prices from the current level or upon completion of the Outer Index Dip 6073, which may lead to a retest of the Mean Support at 5940, with the possibility of extending the pullback to the Mean Support at 5888.

