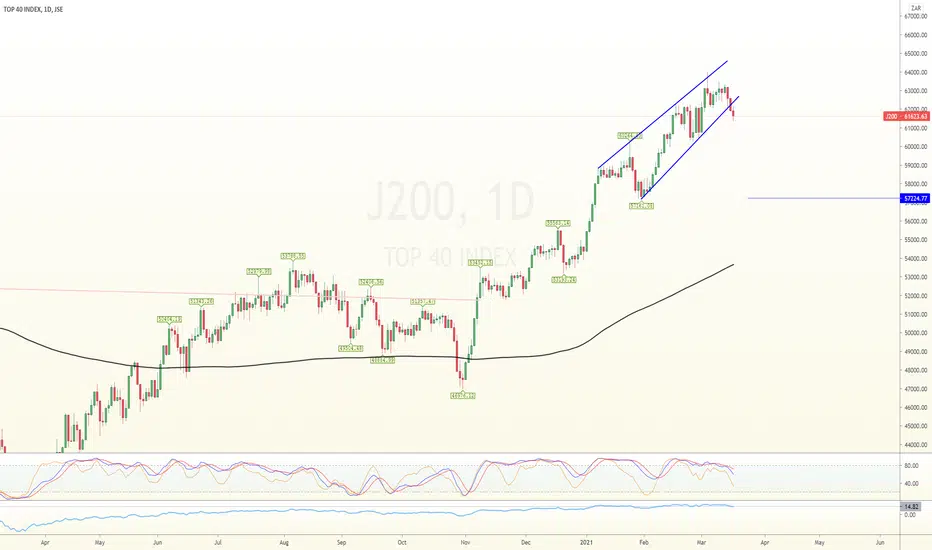
JSE:J200 Looking WeakAs indicated in the post linked below I a break of the trendline could start the markdown. We have now seen this break and a backup to the breakout level. The break occurred on some volume and the attempt to recover could not break the 50Day SMA and could not stay above 60000. This looks very weak and this could be the start of a markdown.
XJSE_TOP40_CFD trade ideas

ALSI/J200 Daily bearish FlagJ200/ALSI has been rejected by its 50dma with a bearish flag formation, Target 200dma
Reward Risk 3:1


MONEY OR THE BOX?- JSE Top40, take your pickThere's two ways to play this.
MONEY:
If you are long Top40 now would be the time to take the money and run. Wait for better levels to get back in. (You heard it here first)
THE BOX:
Short the TOP40 CFD or even the ALSI for at least a test of the bottom of the consolidation box. The move is largely driven by pressure on Naspers and our resources stocks but a re-test of the bottom of the highlighted area would earn you over 1500 points on the index.


JSE:J200 Effort Without ResponseThe Top40 has been on the rise since the covid lows, however, we can now see some cracks and we could be in for a correction back to 53000 for the rest of the year. My reasoning is as follows:
- The buying climax (BC) of the latest trading range could not make it back to the overbought line showing a lack of interest.
- Divergence on the RSI leading into the BC shows the interest to push higher is gone.
- The effort (increase in volume) with each attempt to push higher could not make higher highs.
Based on this it looks like that a break of the trendline could open the path for a drop back to 53000


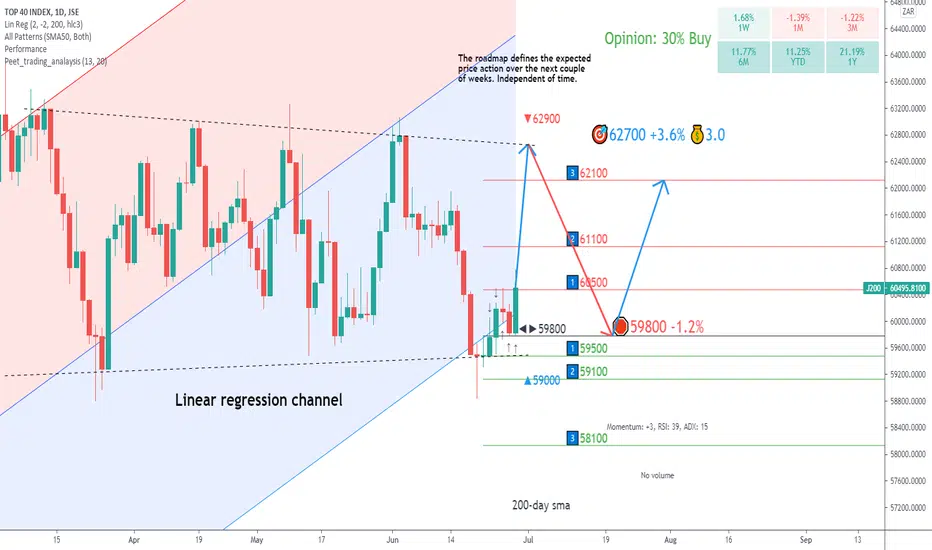
J200 (Top40): aiming higher?Upside price momentum supports the bullish trend direction.
Bullish trend above 59956.
RSI leaves enough room for further upside price potential.
The red and blue parallel lines are the 200-day linear regression channel pattern. A price action close to the boundaries increases the likelihood of a correction

J200 Analysis With all the tension happening in the US stock markets it could have a severe impact on South African markets as well. This is an analysis of the JSE TOP 40. If inflation goes up enough in American markets the federal reserve could take actions to raise interest rates, meaning higher rates reduce stock valuations because why? They weaken the present value of future cash flow of companies traded. And as we all know the US market effects all markets.
Disclaimer: This is not investment advice just a light warning and please invest with caution!
Best of luck.


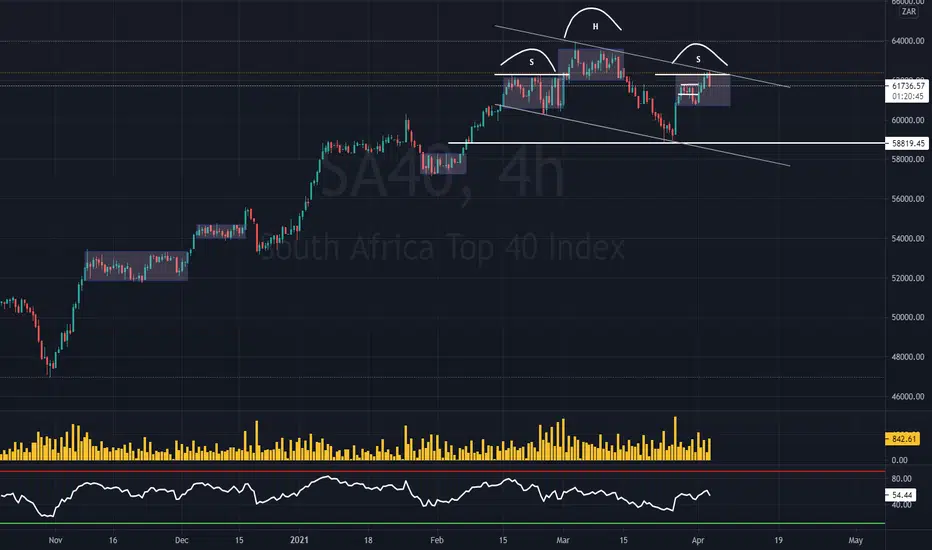
SA40 61716.81 + 0.39 % SHORT IDEA * STRUCTURE & PRICE ACTIONHELLO EVERYONE
HOPE EVERYONE IS DOING GOOD HAVING A GOOD ONE IN THE MARKET THIS WEEK, HERE'S A LOOK AT THE SA 40 INDEX.
* follow your entry rules on entries
* significant moves with the bears change the plan.
lets see how it goes.
many stars must align with the plan before executing the trade, kindly follow your rules.
HAPPY TRADING EVERYONE & LET YOUR WINS RUN...
_________________________________________________________________________________________________________________________
ENTRY & SL - FOLLOW YOUR RULES
RISK-MANAGEMENT
PERIOD - SWING TRADE
__________________________________________________________________________________________________________________________
If this idea helps with your trading plan kindly leave a like definitely appreciate it.

ALSI TOP 40 - Update- The TOP40 is still caught in the 61500 zone but is making lower lows and high highs
- The flattish 20 day moving average explains the choppy/sideways action
- Bulls still in control until 60500 gives way
-- MANAGE YOUR RISK - -
Disclaimer: All ideas are my opinion and should not be taken as financial advice.

TOP40 - 🧐- Bulls managed to move the price back over the 20 day moving average. This bodes well for the market and the recent highs could get tested in the following days...
- I will stay bullish while we above 20 day moving average
--- MANAGE YOUR RISK - -
Disclaimer: All ideas are my opinion and should not be taken as financial advice.


#J200 TOP40 - New Week on the ALSI- The TOP40 has bounced back to the 20 day moving average and the "ambush zone" (0.5 - 0.618 fib levels) of the last move down
- Will be looking for clues over the next two days to see if the bulls can keep up the momentum
Original post in link below
-- MANAGE YOUR RISK - -
Disclaimer: All ideas are my opinion and should not be taken as financial advice.


TOP40 - Observation- The SA TOP40 is currently almost 15% above the 200 day moving average
- Stochastics coming off overbought
- Uptrend is at risk and below 60200, one can expect a deeper pullback with a measured moved possibly lining up with the bottom of the wedge pattern
-- MANAGE YOUR RISK - -
Disclaimer: All ideas are my opinion and should not be taken as financial advice.
S&P500 index analysis(swing to intraday)The S&p has been climbing for the past few days trying to wotk itself to the top of the channel on a daily timeframe (you can copy the chart to view this)
Good news has come from bidens speach today and the US markets were concolidating all day waiting for the news release which turned out positive giving the Nasdaq volumes to breakout while the S&P has not seen so much volumes the nasdaq has started breaking out.
all info is said in video

JSE:J200 Top 40 Consolidation at Start of FebruaryThe JSE has had a good run showing some signs of strength (SoS). After a spring and markup, we tested 60000. Buying interest is lower than November/December which could indicate some consolidation in the short term. This could result in a backup with a set of the breakout level at about 54000. Will watch how this develops.


