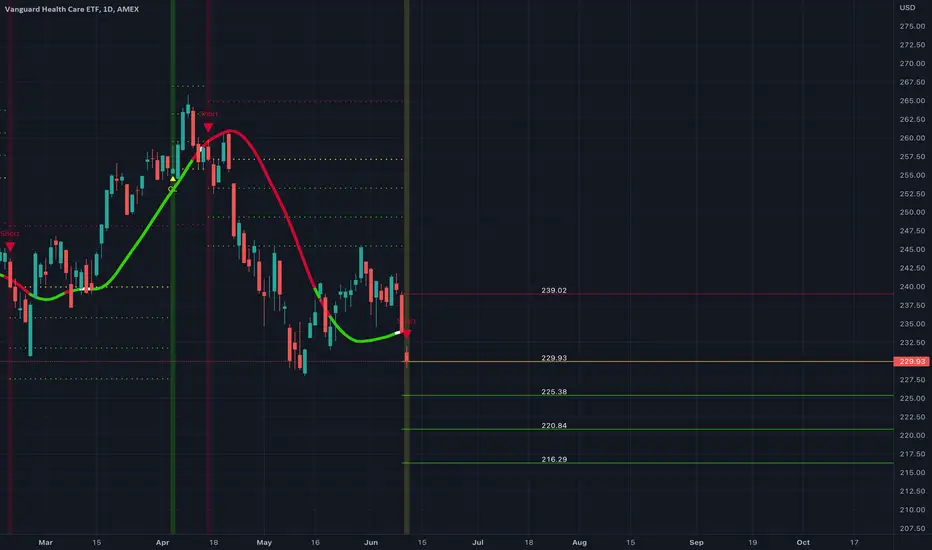
Heathcare hitting new 52 week highs Heathcare is one of the only sectors really breaking out but looking to be shifting to more of a topping pattern like most of its peers
Key stats
About Vanguard Health Care ETF
Home page
Inception date
Jan 26, 2004
Structure
Open-Ended Fund
Dividend treatment
Distributes
Distribution tax treatment
Qualified dividends
Income tax type
Capital Gains
Max ST capital gains rate
39.60%
Max LT capital gains rate
20.00%
Primary advisor
The Vanguard Group, Inc.
Distributor
Vanguard Marketing Corp.
The fund offers broad exposure to healthcare companies in the US. It holds firms that stretch across multiple industries from the broadly defined healthcare space. This includes healthcare provider and services companies, healthcare equipment and supplies manufacturers and distributors, healthcare technology firms, and companies involved in the research, development, production, and marketing of pharmaceuticals and biotech products. The funds large basket stems from its total market universe. Holdings are weighted by market capitalization and are diversified by applying limits on regulated investment companies, such that no group entity exceeds 25% of the index weight and the aggregate weight of issuers with over 5% weight in the index are capped at 50% of the portfolio. The index is rebalanced quarterly.
Classification
What's in the fund
Exposure type
Health Technology
Health Services
Stock breakdown by region
Top 10 holdings
Symbol
Assets
Symbol
Assets
L
Eli Lilly and CompanyLLY
10.95%
U
UnitedHealth Group IncorporatedUNH
7.92%
A
AbbVie, Inc.ABBV
5.48%
J
Johnson & JohnsonJNJ
4.87%
A
Abbott LaboratoriesABT
3.78%
M
Merck & Co., Inc.MRK
3.55%
T
Thermo Fisher Scientific Inc.TMO
3.13%
I
Intuitive Surgical, Inc.ISRG
2.90%
A
Amgen Inc.AMGN
2.75%
U
U.S. Dollar
2.69%
Top 10 weight48.01%
407 total holdings
No news here
Looks like there's nothing to report right now

VHT & Healthcare coiling up falling RSI big move incomingI do not hold VHT but instead the vanguard healthcare mutual fund as a play on an undervalued sector of the market. Many key holdings are down 40+% including Pfizer and I believe this is a great hedge for a recession in the coming 2-3 years. I have used this VHT chart to help with my entries around

VHT - Retests Former SupportThe Vanguard Health ETF hit a well-established level of former support (current resistance). Fibonacci levels also indicate a level of resistance around $249. The temporary upwards move looks like a kickback, a retest of that former support, and the stock will likely begin to move lower in coming we

VHT at a good level to add to investmentVHT is the ticker for Vanguards healthcare ETF that seeks to track the MSCI US IMI Health Care Index. I use this ETF as part of my long term investing strategy to gain exposure to the US healthcare sector which I believe will experience greater growth and lower drawdowns then the general market over


See all ideas
Summarizing what the indicators are suggesting.
Oscillators
Neutral
SellBuy
Strong sellStrong buy
Strong sellSellNeutralBuyStrong buy
Oscillators
Neutral
SellBuy
Strong sellStrong buy
Strong sellSellNeutralBuyStrong buy
Summary
Neutral
SellBuy
Strong sellStrong buy
Strong sellSellNeutralBuyStrong buy
Summary
Neutral
SellBuy
Strong sellStrong buy
Strong sellSellNeutralBuyStrong buy
Summary
Neutral
SellBuy
Strong sellStrong buy
Strong sellSellNeutralBuyStrong buy
Moving Averages
Neutral
SellBuy
Strong sellStrong buy
Strong sellSellNeutralBuyStrong buy
Moving Averages
Neutral
SellBuy
Strong sellStrong buy
Strong sellSellNeutralBuyStrong buy
Displays a symbol's price movements over previous years to identify recurring trends.