Salesforce calls. Just for you dont buy this.
It's interesting to note the brackets and the current trend line. If by chance breaking the support, we know that the line has a high probability of being touched ..
If by chance the line is being played, it is very important to observe the RSI. RSI will help you understand what the next trend will be.
But honestly ... I've been pessimistic about US companies in the past 4 months.
Why am I pessimistic?
Link: www.usdebtclock.org
CRM trade ideas

SALESFORCE.COM LONGSALESFORCE.COM LONG
The company's flash report will be on November 27th. In September, $ 180 - $ 190 received $ 165 - $ 174 in October. A steadily growing company, analysts, are also predicting a positive future. Looking at a technical picture, it looks like a support has been able to rebound and to overcome the 200-day moving average. Now trading between the $ 140 resistance and the 200-day moving average. In RSI, there is a divergence, which means that the exchange rate has been able to develop deeper points that the RSI indicator is getting higher and higher. RSI has to move with the exchange rate if there is a deviation, it may indicate the turn. Looking at the rise in the previous August, it appears that the elevation based on the Elliott Waves principle was followed by the 3-stage A-B-C correction. If I have correctly tagged the waves, then another 5-wave rise is expected in the exchange rate. The more robust resistance can be close to $ 150, if the exchange rate is worth it, it is worth pounding the profit. If you can not go through the next $ 140 resistance, the 200 mover again needs to catch the price from below, as long as you do not close again during 200, the exchange rate is in the rise.

CRMRally to new highs and then sell off in tech sector down to swing low 61.8% retracement. Long term view (late 2020) looking at $215.


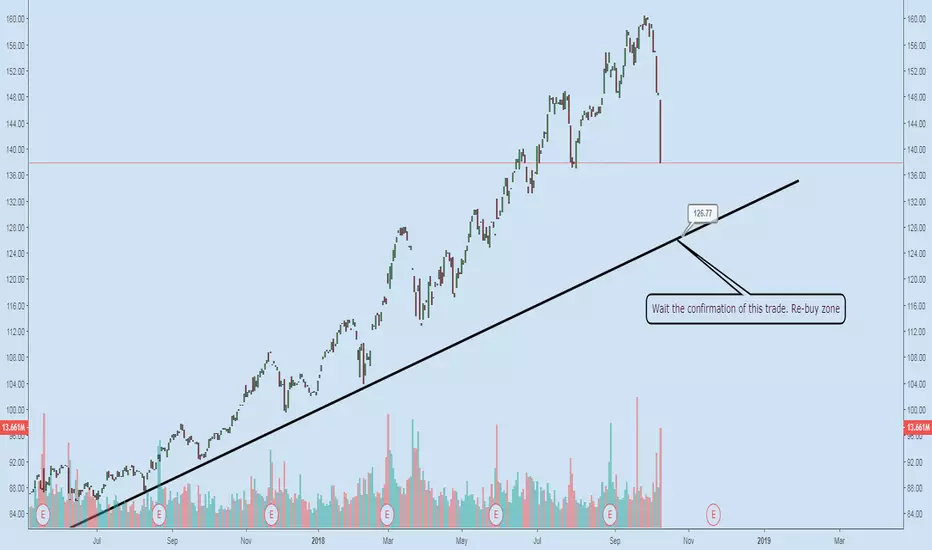
Waiting for re-buy zone. Salesforce
It's an easy strategy. Expect her to hit the trend line and see if a raise is possible. Otherwise expect some zones below.
CRM Long in the ToothCRM coming back down to trend support here in an ascending wedge pattern. IT already came crashing down to the Monthly VPOC here. It looks to me still a deeper correction setting up here.

CRM bearish divergence pointing to short term correctionCRM is a name in a long term uptrend I really like for a long, and the technicals are telling me a long signal may be coming up soon. But first, we're getting some pretty clear short signals that I fully intend to take advantage of.
CRM has been trending up in a long term channel and recently the lower support line has risen much sharper while the resistance line remains the same, giving us a beautiful descending wedge pattern to play off of. Resistances right now are the Upper Bollinger Band and the upper resistance of the channel. While Salesforce has been able to breach the Upper Bollinger Band in the past, it generally cannot maintain the breakout for long, and always rejects hard when up against the channel resistance.
Further, the daily chart is setting up bearish divergence on the MACD and RSI oscillators, adding to my confidence of a short term correction in the near future.
We currently have a double bottom on the daily at 158.93, the loss of which could signal an earlier entry. I'm looking for a loss of the hourly higher lows to signal an entry - in the current formation that would be a loss of 158.12 support. My profit target would be to cover in the $150-145 range, and I would cover for a loss if we set a new all time high above 161.08.


CRM is nearing support before potential bull runCRM is nearing strong support at $150 and has recently bounced strongly 3% of of that support yesterday. CRM looks to have also created a steep bull run in the past year. Given the increase in momentum and no real concerns from analysts, CRM has a good chance at touching the top of it's channel come January at the $180 area. The January calls at strike $160 are trading at just under $8, but will fall to the $6.50 area if CRM retests $150. Given a potential $180 run by mid January, I'd give those calls a 1/3 risk/reward ratio if held until expiration, or an even better risk/reward of 0.5/3 if willing to cover in the even that $150 breaks. I'm waiting until CRM either nears $152.5 or breaks above $157.5 to enter the aforementioned calls.

Highly predictable channelIts been following this channel very well; it really shows that big players do consider this a moderate buy signal. A strong buy would have a much steeper slope imo.
Look for the bounce at the bottom of the channel. And if confirmed, then is an easy few percent up.
Safe play imo.


CRM Ascending Triangle Throwback - Upward Channel TrendAscending Triangle Breakout which has led to a throwback to the 148 level and will continue in the upward trending channel

CRM - recommended stockCRM is recommended by many analysts, while it has a Hold on Zacks Rank.
It doesn't have very good fundamentals (P/E is 166.5 and it has low ROA, ROE, ROI). Insiders are selling the stock. I am not sure if it is a good stock to purchase at the moment.
However it goes from high to high. I am curious if the analysts made the right decision about this stock

CRM Short? Risky $150 Strike Put Option?So, CRM traded After Hours yesterday around the low $148s after earnings until all the Analysts upgraded their price targets this morning.
That said, the stock opened at $153~ish. Well I think the first A wave down is still on going and we will be heading to the C wave of the first ABC (A), i'm thinking its going to be a 3-3-5.
That said, Friday, I am looking for a price target of under $150 in the morning.
Maybe this is crazy but it is what I see.
Bear Flag just broken at end of day? (ABC)
