JNJ trade ideas


JNJ : Look and buy and hold foreverToday Johnson & Johnson published the results of the last quarter up on the previous year but not better than consensus. the full year has seen an increase over the previous year. The fundamentals are good. We look at how far can this descent for a buy and hold forever. By analyzing the fundamentals, all areesegnate is a good buy for the long term. Supports in the area 117.3 - 112.5 - 109.5 to 106.6


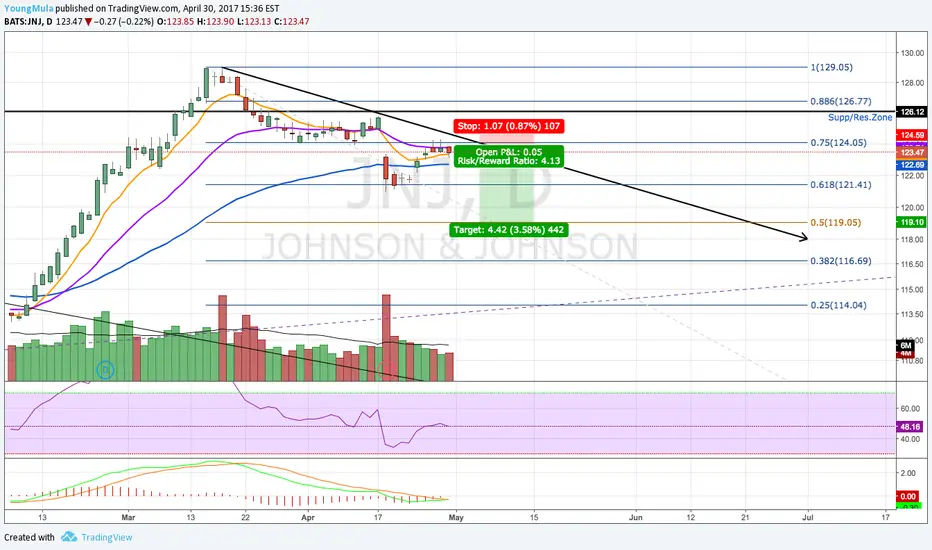
Double Top Resistance Approaching Quickly On $JNJ.Healthcare products maker Johnson & Johnson (NYSE:JNJ) is nearing a double top resistance point on the stock chart. The level is $126 and is the former all-time high on the stock from July 2016. A double top on the stock chart is a technical term that tells investors there will be heavy selling at that point. It likely will be tough for Johnson & Johnson to go higher in the near-term. Often, investors and traders will sell double tops short, profiting when the stock pulls back. That is what I will be looking to do if Johnson & Johnson hits double top this week. The stock has run too far, too fast in the last few weeks. In the last month, Johnson & Johnson is up from $111 to $124. For this historically slow moving stock, that is insane.
Follow my trades live right here: verifiedinvesting.com


Johnson & Johnson (JNJ)The acquisition of Actelion for 30 mld dollars is a good strike, the EPS for the 2017 are at 6.60 dollars (1.65 dollars for quarter), this equity has a good yield and bright dividend growth prospects. In our view we think that it is a buy stock, with an interesting dividend yeld of 2.85%

JNJ @ daily @ closed last 6 trading days lower every dayThis is only a trading capability - no recommendation !!!
Buying/Selling or even only watching is always your own responsibility ...
.zip (with PDF`s) @ my Google Drive
Closings Bearish (Dow Jones Index incl. all shares)
drive.google.com
Best regards :)
Aaron
