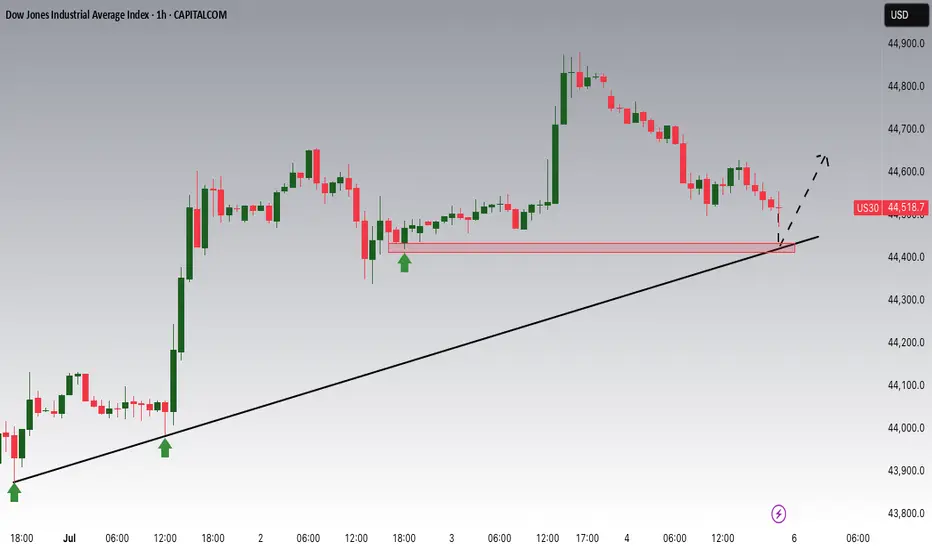
Dow Jones Potential UpsidesHey Traders, in tomorrow's trading session we are monitoring US30 for a buying opportunity around 44,400 zone, Dow Jones is trading in an uptrend and currently is in a correction phase in which it is approaching the trend 44,400 support and resistance area.
Trade safe, Joe.
No news here
Looks like there's nothing to report right now

DOW Jones go upCMCMARKETS:US30
Reaching the price level of 45,082.74 is inevitable. From the current closing price, there is a high probability of continuation toward the ATH.
However, the price levels 44,440 and 44,344.95 are also acceptable zones from which the move toward 45,082.74 may begin.
At the start of

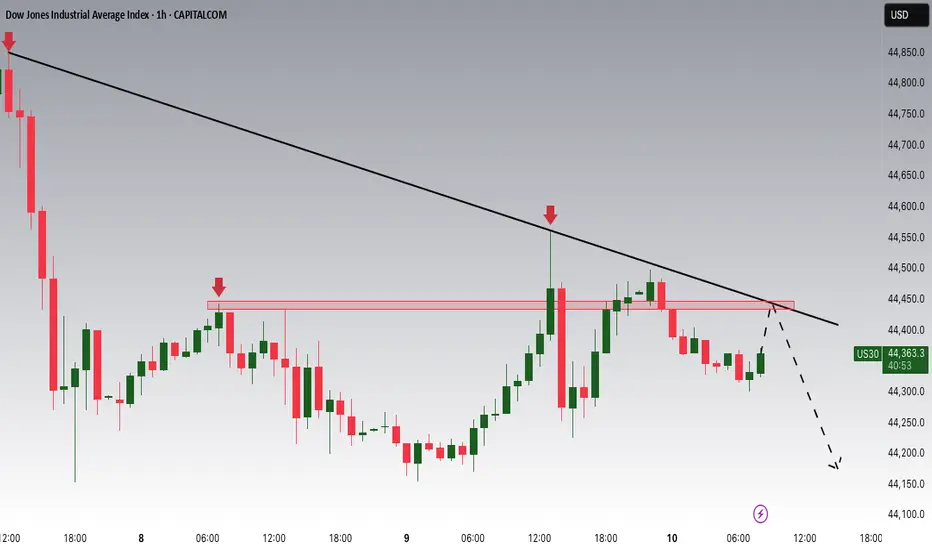
Dow Jones Potential DownsidesHey Traders, in today's trading session we are monitoring US30 for a selling opportunity around 44,450 zone. Dow Jones is trading in a downtrend and currently is in a correction phase in which it is approaching the trend at 44,450 support and resistance area.
Trade safe, Joe.
Dow Could Be Gearing Up for a Run Toward 50,000We’ve seen it before—and we might be seeing it again . The Dow Jones is showing a familiar pattern, and here’s what’s happening:
The index has been repeatedly hitting the 1.618 Fibonacci extension from previous ranges.
Right now, we’re approaching the 100% extension between the last swin

US30: Will Go Up! Long!
My dear friends,
Today we will analyse US30 together☺️
The market is at an inflection zone and price has now reached an area around 44,585.50 where previous reversals or breakouts have occurred.And a price reaction that we are seeing on multiple timeframes here could signal the next move up so

US30 Is Bearish! Sell!
Please, check our technical outlook for US30.
Time Frame: 12h
Current Trend: Bearish
Sentiment: Overbought (based on 7-period RSI)
Forecast: Bearish
The price is testing a key resistance 44,371.8.
Taking into consideration the current market trend & overbought RSI, chances will be high to see a

KOG - US30US30
Looking at this we have a clean reversal in play suggesting we’re going to get lower order regions before a potential RIP. The red boxes have been added and may give us opportunities to capture the tap and bounces on the smaller TFs.
If we can support lower, we could very well see this pus

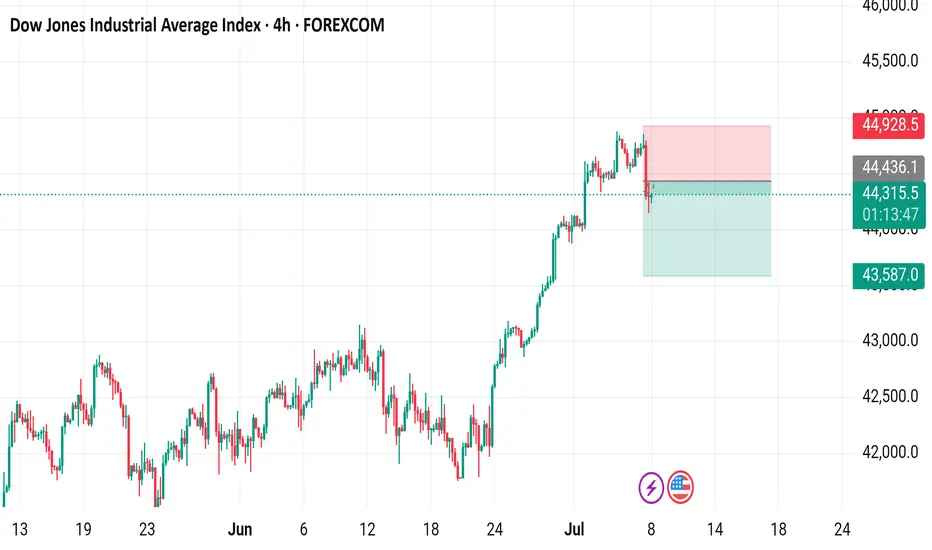
Dow Jones Industrial Average Index - 4h Chart (FOREXCOM)4-hour candlestick chart of the Dow Jones Industrial Average Index (US30) showing the price movement from late June to early July 2025. The current price is 44,314.0, with a slight increase of +23.0 (+0.05%). The chart includes buy and sell signals at 44,316.5 and 44,310.5 respectively, with highlig

See all ideas
Displays a symbol's price movements over previous years to identify recurring trends.
Frequently Asked Questions
Wall Street CFD reached its highest quote on Dec 4, 2024 — 45,078.5 USD. See more data on the Wall Street CFD chart.
The lowest ever quote of Wall Street CFD is 12,008.5 USD. It was reached on Jun 4, 2012. See more data on the Wall Street CFD chart.
Wall Street CFD is just a number that lets you track performance of the instruments comprising the index, so you can't invest in it directly. But you can buy Wall Street CFD futures or funds or invest in its components.