US30 BEARISH AGAINhi there, how's going on?
My last analysis didn't go well. This is my new analysis. I'm still on the same decline as before.
What you think about it? is it go well or not?
WALLSTREETCFD trade ideas


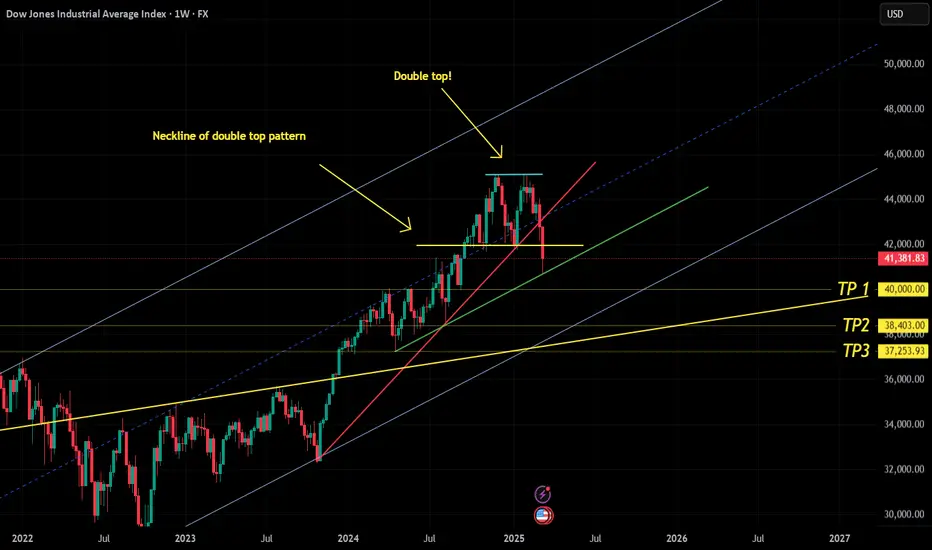
Moustafa! My analysis and view for US 30! on 16.03.2025!- I expected a huge bearish wave would hit the index by end of December and also in January and I sat an idea for it and it was right and that is the new idea
- On the weekly frame, you would notice that the index is in a rising channel
- Formed a double top pattern and even broke the neckline of it and is supposed to go to minimum the Take profit 2 then after the retrace towards the take profit 3
- The index retraced to the upside due to the uptrend line in green and there is a possibility that it could continue the bullish run but I do not expect here that a weekly candle would close above the neckline before reaching to the below TPs
- The lower weekly candles wicks from 15.04.2024 and 05.08.2024 must be filled anyway, which is giving another confirmation to the validation of this idea concept and the continuation of the bearish wave on the weekly chart! we could see on the way some retracements on the daily frame and the lower frames, but that will not have any influence on the bigger bearish image!
- The index had broken already the uptrend line (in red) which was not broken from October 2023! and the last week candle closed under the moving average 50!
- By reaching to the TP3, means that the index would go to the lower line of the rising channel
-- Conclusion is that we are in a bearish market on the weekly chart and the real target is exactly when the index will reach to the line (in yellow)
I sat also another idea for Nasdaq
which I see also there the continuation of the big bearish wave on the weekly chart! so feel free to have a look on too! so all is going in harmony together!
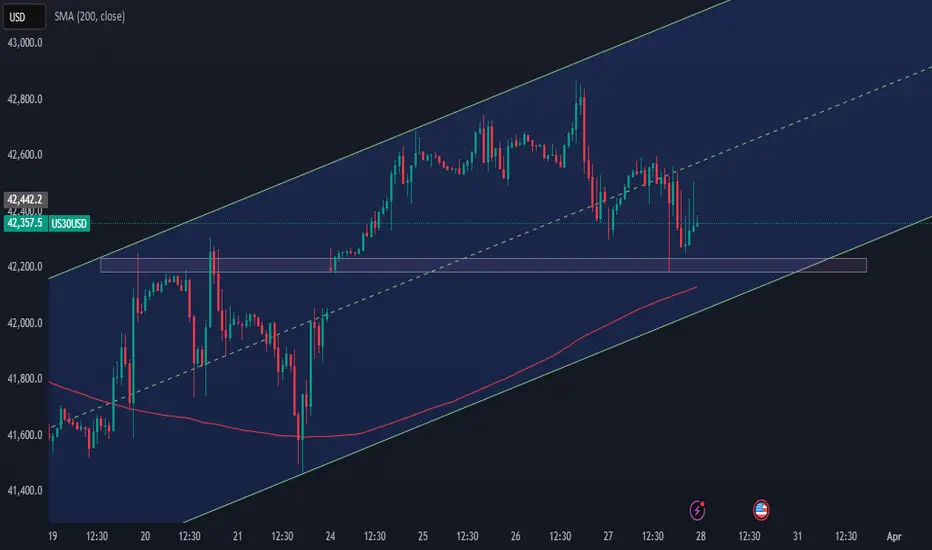
US30 Trade Outlook – 27/03/2025📊 Market Structure & Key Levels
US30 is showing signs of exhaustion after a strong bullish leg. Price is currently consolidating below 42,787 – 42,872, a key resistance zone. Bulls must break this area cleanly to maintain momentum.
🔍 Key Observations:
✅ EMAs Flipping – Price dancing around EMAs, showing indecision.
✅ Resistance Holding – 42,787 – 43,021 still capping upside.
✅ Support Zones – 42,200 and 41,529 are levels to watch for a deeper pullback.
🎯 Trade Plan:
🔻 Short if price fails to break 42,872 → Target 42,200, then 41,600
🔹 Long if price clears 43,021 with strength → Target 43,400 – 43,600
⚡ Let price lead. No bias. Confirmation is key.


Dow Jones at trendline support: Will it bounce to 44,812$?CAPITALCOM:US30 is undergoing a corrective pullback after forming a double top near the upper boundary of the ascending channel. The rejection from this resistance zone triggered increased selling pressure, driving the price back toward the lower boundary of the channel, where buyers are now looking to step in.
If buyers step in and defend this support, we could see a move toward the midline of the channel, with the next key target at 44,812. Holding above this level would reinforce the bullish trend structure and increase the probability of continuation toward the upper boundary of the channel.
However, a failure to hold trendline support could weaken the bullish outlook, leading to a potential breakdown and further downside pressure. Price action near this critical zone will be key in determining the next directional move.
Traders should monitor candlestick formations and volume for confirmation. As always, managing risk effectively is essential when trading this setup.
If you have any thoughts on this setup or additional insights, drop them in the comments!


Bearish reversal off pullback resistance?Dow Jones (US30) is rising towards the pivot which is a pullback resistance and could drop to the 1st support.
Pivot: 42,476.16
1st Support: 41,442.18
1st Resistance: 43,185.84
Risk Warning:
Trading Forex and CFDs carries a high level of risk to your capital and you should only trade with money you can afford to lose. Trading Forex and CFDs may not be suitable for all investors, so please ensure that you fully understand the risks involved and seek independent advice if necessary.
Disclaimer:
The above opinions given constitute general market commentary, and do not constitute the opinion or advice of IC Markets or any form of personal or investment advice.
Any opinions, news, research, analyses, prices, other information, or links to third-party sites contained on this website are provided on an "as-is" basis, are intended only to be informative, is not an advice nor a recommendation, nor research, or a record of our trading prices, or an offer of, or solicitation for a transaction in any financial instrument and thus should not be treated as such. The information provided does not involve any specific investment objectives, financial situation and needs of any specific person who may receive it. Please be aware, that past performance is not a reliable indicator of future performance and/or results. Past Performance or Forward-looking scenarios based upon the reasonable beliefs of the third-party provider are not a guarantee of future performance. Actual results may differ materially from those anticipated in forward-looking or past performance statements. IC Markets makes no representation or warranty and assumes no liability as to the accuracy or completeness of the information provided, nor any loss arising from any investment based on a recommendation, forecast or any information supplied by any third-party.


Dow Jones Analysis for the Coming DaysEntering a buy position on the Dow Jones requires confirmation on the 15-minute timeframe after breaking out of the classic triangle, with a risk-free position around the 42,500 level. If the price breaks out of the triangle and then pulls back with strong momentum—most likely intended to shake out retail traders and trigger stop hunts—it is possible to enter with a larger-than-usual position and a very tight stop-loss.
If the support level is broken, the analysis will be considered invalid. The "strong momentum pullback" to the support level refers to the red rectangle. If the price returns to the support zone with very strong momentum, an entry can be taken with a very tight stop-loss.

US30 - Catch The Next Wave!US30 is currently in an uptrend, with price action respecting a well-defined ascending channel. We anticipate another bounce from channel support.
In Wave 2, price was rejected at the 38.2% Fibonacci retracement level, and we expect a similar reaction for Wave 4.
Our strategy is to wait for price to enter the buy zone, between the 38.2% and 50% Fibonacci retracement levels, and look for bullish reversal signals before entering a position.
Potential Bullish Reversal Signals:
Trendline break
Break of structure (BOS)
Other confirmation patterns
Trade Plan:
- Monitor price movement into the buy zone, aligning with channel support.
- Enter long positions upon confirmation of bullish price action, placing stop-loss below the established low formed after bullish confirmation.
Target levels: 45,000 and 48,500, with the remainder held for a potential extended swing trade.
Goodluck and as always, trade safe!


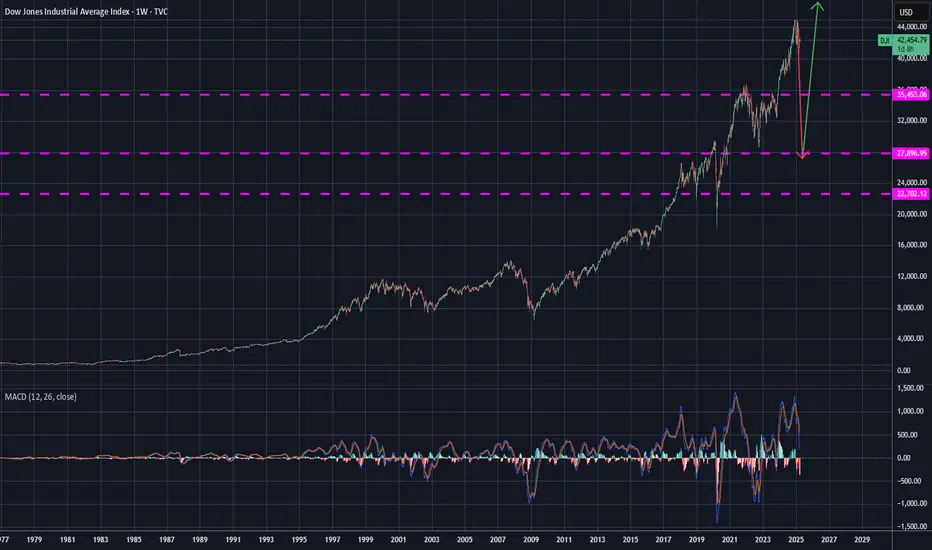
DOW JONES: Are you ready for what's coming?Dow Jones is neutral on its 1D technical outlook (RSI = 48.157, MACD = -244.290, ADX = 38.724) as it is attempting to recover the 2 month correction. It appears that the bottom has already been made as not only did the price rebound on the LL trendline but it did so on an oversold 1D RSI. This draws comparisons to the last big such correction of Aug-Oct 2023, which also declined by more than -9.40%. They key there was the formation of a 4H Golden Cross.
Right now the price is stuck inside the 4H MA50 - 4H MA200 range, so if it crosses now over the 4H MA200, it will most likely confirm the start of the new bullish wave as it will form a 4H Golden Cross. Technically it can achieve a similar price rally as then, so our thesis remains bullish aiming at the 2.0 Fibonacci extension (TP = 50,000).
## If you like our free content follow our profile to get more daily ideas. ##
## Comments and likes are greatly appreciated. ##


Dow Jones - Pivotal moment for the bulls and bears!The Dow Jones Industrial Average is currently approaching a critical juncture, as it risks breaking below and staying under the neckline of a potential double top pattern. A double top formation is typically a bearish signal, indicating a potential trend reversal after the price tests a key resistance level twice, failing to break higher. The neckline, which forms the base of this pattern, is the level that traders will be watching closely to determine the strength of this bearish signal.
If the Dow breaks below and stays under the neckline, it could trigger further downside momentum as liquidity is swept from the market. However, it's essential to note that this initial breakdown could just be a "liquidity sweep," a move designed to trigger stop-loss orders and shake out weaker hands. For the Dow to maintain its bullish potential, it must quickly recover and hold above the neckline after this sweep. If it can do so, the market may find stability and begin to look for higher prices again, as the double top formation would then be invalidated, and a more bullish outlook could emerge.
In summary, while the Dow Jones is at a pivotal moment, the key to higher prices will be whether it can hold above the neckline after sweeping liquidity. A failure to do so could signal further downside, but a strong recovery above the neckline would leave the door open for a potential rally.
For now the Dow jones swept the liquidity under the neckline. However, it needs a quick recovery to maintain and find support on the neckline again. The risk that it now faces is the resistance of the 50, 100 and 200-day MA. Staying above the neckline and reclaiming these MA could be a massive bullish signal on the Dow Jones.
Thanks for your support.
- Make sure to follow me so you don't miss out on the next analysis!
- Drop a like and leave a comment!
Lets chat in the comment section. See you there :)


US30: Dow Jones Rebounds as Buyers Emerge Near 40,700Dow Jones Rebounds as Buyers Emerge Near 40,700
The Dow Jones (US30) entered a bearish trend at the end of January, with its downward movement largely influenced by the Trump administration's reforms and unconventional approaches to the trade war.
Over a span of approximately 2.5 months, the index declined by nearly 9.7%. However, it now appears that buyers are stepping back in near the 40,700 level, providing momentum for a potential bullish correction—or perhaps even a return to the previous uptrend.
Looking ahead, US30 is expected to recover, with key levels to watch at 42,320 and 42,935.
You may find more details in the chart!
Thank you and Good Luck!
❤️PS: Please support with a like or comment if you find this analysis useful for your trading day❤️

Showing signs of a potential bearish reversal.📍 Entry: Around 42,746.9
📍 Stop Loss: Above 42,780.1 (To limit risk in case of a bullish continuation)
📍 Take Profit: 42,567.6 (Targeting the next key support area)
🔹 The price formed a strong rejection candle, indicating selling pressure.
🔹 Increased volume at the top suggests potential distribution.
🔹 A clean break below the recent support zone could accelerate the downtrend.


Hanzo | US30 15 min Breaks – Confirm the Next Move(🆚) US30 – The Way of the Silent Blade
🔥 Bearish Break Out Path – 42440
🩸Liquidity Sweep – Stop-clearing before reversal.
🩸CHoCH – Bearish trend confirmation.
🩸Key Level Retest – Historical reaction zone.
🩸Weekly/Monthly Zone – High-probability sell area.
👌 Entry: Break 42440 + momentum → Retest → Short position → Target lower liquidity.
☄️ Trading Insights:
💯 Liquidity moves the market.
✈️ Volume confirms breakouts.
👍 Precision wins—no hesitation.
