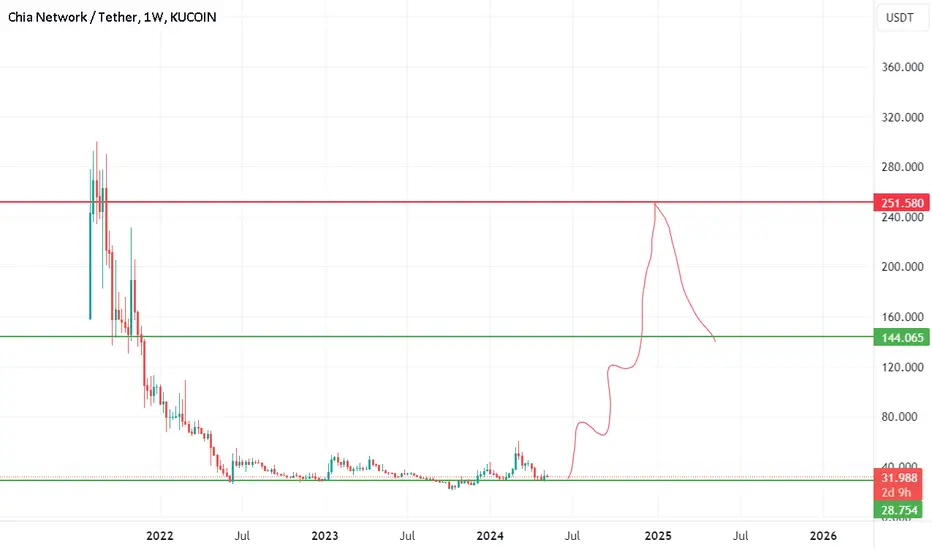
Possible scenario in next few weeks!Hi there
BTC was at ATH and XCH at ATL.
Can it go more lower or finally found the bottom?
Anyway, this scenario can happen in short term.
For this we need also BTC correction to level 93000-94000.
Good luck traders
XCHUSDT trade ideas

CHIA NEW GIANT IN TOP 10 PROJECTSthis project is huge, this like dot, ada, eth or solana.
buy !
1) 106$ 33% (right now )
2) 70$ 33%
3)50$ 33$
targets
1)500$
2)800$
3)1500$
4)3000$
5)6600$
gl guys!

Bottomed?Hi there!
Let's see upside targets for Chia!
CoinDesk prediction is around 64 USD in one month let's see why!
coincodex.com
Our higher target in this case is almost same that is the upper trend line of broadening triangle.
Also, we have many middle targets and resistance levels!
Good luck traders

Chia Network XCH Is Ready For Altseason!Hello, Skyrexians!
While altcoins are still in the correction and we have the great buy opportunities we continue observe altcoins ant their targets for bull run. Today we have OKX:XCHUSDT for analysis. I know most of people hate this coin because of its permanent dump. Today we will try to understand if Chia holders have any chance to see the breakeven or profit for their investment.
Let's take a look at the weekly time frame. This coin is definitely in the downtrend and we cannot wait for the new ATH. The downward move has the clear 5 Elliott waves structure which is likely to be finished already. The green dot at the bottom for Bullish/Bearish Reversal Bar Indicator is the strongest confirmation for the bull run start. As always, alerts from this indicator are automatically replicated on my accounts. You can find the information in our article on TradingView .
Target for the bull run is the zone between Fibonacci 0.5 and 0.61 at $200 and $340. This is global downtrend coin, so we expect the new all-time low after reaching this target during the altseason.
Best regards,
Skyrexio Team
___________________________________________________________
Please, boost this article and subscribe our page if you like analysis!

Good days are coming up for CHIAChart is clear. Buy at the dark green line sell at the specified point then wait for the next entry point which is the light green line, buy & HODL . I'll update after the pullback the price reaches that box with the red line. Apart from all this chia is a good project and might have a bright future ahead of it so I reccomend it. 💚🌱🚀

XCHUSDT | Buy Now, Thank Later | Near Term (4HR)XCHUSDT | Buy Now, Thank Later | Near Term (4HR)
Its ready to go. This is it.
BTCUSDT | Alts Poised to Explode | Near Term (2H)
MYRIAUSDT | Interested to see where this goes | Mid Term (2D)
Mock Up Price Action for VRA w/ Timeline | Mid Term (3D)
Mock Up Price Action for XCH | Mid Term (12HR)
OGNUSDT | Interested to see where this goes | Mid Term (3D)
Mock Up Price Action for CSPRUSDT | Near/Mid Term (2D)
VIDTUSDT | Interested to see where this goes | Mid Term (3D)
RAREUSDT | Interested to see where this goes | Mid Term (3D)
Mock Up Price Action for ALGOUSDT | Mid Term (12HR)

XCHUSDT | Buy Now, Thank Later | Near Term (4HR)XCHUSDT | Buy Now, Thank Later | Near Term (4HR)
Money flow... BTC, then ETH, then Large Caps, Then Mids and Smalls
Additional altcoin near term and midterm chart ideas listed below
Timeline of events for the Bull Market indicated on chart
VRAUSDT | Buy Now, Thank Later | Near Term (4HR)
CSPRUSDT | Buy Now, Thank Later | Near Term (4HR)
PERPUSDT | Buy Now, Thank Later | Near Term (4HR)
TLMUSDT | Buy Now, Thank Later | Near Term (4HR)
DODOUSDT | Buy Now, Thank Later | Near Term (4HR)
LPTUSDT | Buy Now, Thank Later | Near Term (4HR)
VRAUSDT | Buy Now, Thank Later | Near Term (4HR)
XCHUSDT | Buy Now, Thank Later | Near Term (4HR)
CSPRUSDT | Buy Now, Thank Later | Near Term (4HR)
VELOUSDT | Buy Now, Thank Later | Near Term (4HR)
UMAUSDT | Buy Now, Thank Later | Near Term (4HR)
OGNUSDT | Buy Now, Thank Later | Near Term (4HR)
DOTUSDT | Buy Now, Thank Later | Near Term (4HR)
VIDTUSDT | Buy Now, Thank Later | Near Term (4HR)
BTCUSDT | Alts Poised to Explode | Near Term (2H)
Mock Up Price Action for ALGOUSDT | Mid Term (12HR)
MYRIAUSDT | Interested to see where this goes | Mid Term (2D)
Mock Up Price Action for VRA w/ Timeline | Mid Term (3D)
Mock Up Price Action for XCH | Mid Term (12HR)
OGNUSDT | Interested to see where this goes | Mid Term (3D)
Mock Up Price Action for CSPRUSDT | Near/Mid Term (2D)
VIDTUSDT | Interested to see where this goes | Mid Term (3D)
RAREUSDT | Interested to see where this goes | Mid Term (3D)

Choosing Chia Network: Can It Grow? (825% - 1,471% Potential) I looked at some charts and passed one and said, nope; then another and another one... At one chart I stopped and thought, "this one looks good but there is something, I know that it needs more sideways... There is something missing."
I went back to look at all the trade-numbers I shared yesterday and looked at the difference; because some charts look good, they can produce a small jump but they still have 3-4 months left of consolidation. In this 3-4 months, they can produce a new low and it would be a waste to share them today, better share them when they are closer to breaking out.
After going through a few more charts, I found the difference; while some will be consolidation sideways with the doors open for moving down, potentially a new lower low, others will grow a bit then retrace to grow some more. The retraces would clearly end in a higher low which means that the probabilities are small for lower lows; which means that the bottom is in.
That was the difference. Those that did click were the ones that looked like the bottom was already in. I say "looked like" because in the end we don't truly know how the short-term action will develop. We can predict with 100% accuracy the long-term direction but the rest can be doubted without end.
Chia Network (XCH) looks like it already hit bottom and is ready to grow next.
Namaste.

XCH | Inverse Chart, Dump Inbound | Mid Term (1W)XCH | Inverse Chart, Dump Inbound | Mid Term (1W)
The inverse chart of XCH definitely does not look like the chart of something I would buy...

Mock Up Price Action for XCH | Mid Term (12HR)Mock Up Price Action for OKX:XCHUSDT XCH | Mid Term (12HR)
- Perfect spot now and down to this price point are where for me is now the ideal area to be more heavily accumulating. Likely the very last correction panic volatility low we'll see in 2024 and before 2025 altseason bull runs.

XchusdtHello snipers. The price has been able to get out of the downward channel after a long time and stuck below the moving average, if this hypothetical resistance line is broken, we can expect an increase.

XCHUSDT (Short term Bearish)The provided chart of the XCHUSDT perpetual swap contract shows that the price is approaching a significant support level around 19.43-19.23. The volume analysis indicates a bearish sentiment in the short term, as evidenced by the downward trend in volume sentiment and a net volume measurement of -3.075M, signifying stronger selling pressure compared to buying pressure. The current selling pressure has not been countered sufficiently to reverse the trend, suggesting that the price may continue to decline unless buying volume increases significantly.

Chia > $900 - $1,900🌱 (CHIA/USDT) (July 4, 2024) (#Chia #Spot)
Chia is a promising cryptocurrency that I've been following for a long time, focusing on mining using hard drives.
Do you remember the days of GPU mining?
There was clearly collusion with Nvidia and AMD, which caused stock prices to rise, as well as Ethereum itself :). Here, the situation is similar, involving major companies like Seagate and Western Digital that produce hard drives.
Why set price targets at $1000-$3000?
Because there will come a time when people will be buying hard drives in stores for mining, and the payback period for the Chia coin will be 3 months. That will be the time to lock in positions. Additionally, Chia will survive crypto regulation, and they plan to go public with an IPO.
Chia (CHIA) — Chia is a company that has developed a blockchain and cryptocurrency platform called Chia Network. It is an alternative to Bitcoin and other cryptocurrencies, but with a focus on energy efficiency and sustainable mining practices.
▫️ Chia can be obtained through farming, which involves using storage space instead of computational power to secure the network. Additionally, Chia has a strong community of users and has gained recognition in the academic field through various papers and presentations.
🕵️ Investors (Tier 1,2):
a16z (Andreessen Horowitz, IDEO CoLab Ventures, DCM Ventures, Naval Ravikant, Slow Ventures, Greylock Partners.
dropstab.com
cryptorank.io
🟢 Entry price: $22.15
🟢 Take Profit 1: $900 (50%)
🟢 Take Profit 2: $1900 (50%)
Chart:
• Spot Market without leverage.
• Trade risk set at 20% of the deposit.

Minimum target around 40!Hi there!
This is the moment for new buys with high probabilty optimal targets!
If BTC will go up this can happen easy!
If BTC will remain consolidate this can happen easy too!
If BTC go to some deeper level, than forget this scenario!
Good luck traders

XCH sideways since a while and can dump or pumpStill Open Questions
IPO?
Partners and progress in industry adoption?
Ledger support?
Binance, Kraken, Coinbase listing?
Additional Risks
1) Too high XCH supply via Market Maker (CNI prefarm loans and sales) *)
2) Possible sell offs by unprofitable XCH farmer
No financial advice, just my opinion.
*) ~60k XCH per month additional supply hit the market since Q4 2023, ~ 550k XCH in total. Farmed supply per month is ~ 140k since halvening. So it's roughly +40% more supply than people expected after halving before they started to sell, even that the supply is lower than before the halvening.

XCH on Risk but with Potential?The old "Maybe Bottom" did not hold on the news that Chia Network Inc will sell 200k XCH worth ~ 5 Million USD from the prefarm.
The questions are:
- How many prefarm XCH will get sold the next years and how often? This risk now is clear visible.
- How is the financial situation that selling part of the prefarm was worth the lost in trust?
- How far in the future is the IPO?
- How is the situation about potential B2B customers and partners?
In case it isn't that bad the XCH downtrend could turn around. More bad news on the other hand could create a massive loss in value. In my opinion the risk is very high, higher than before. I am not sure if that is realy reflected in the price, so the new "maybe bottom" is weak.
XCH trend was always off the general crypto market even that the trend influences the XCH trend. XCH and Chia Network as a brand is also not worth much currently. Outside of the Chia space it is unrecognised, forgotten or viewed as a scam. But this is not necessarily a bad thing at this point.

XCH/USDTCryptocurrencies have steadily become a global phenomenon that continues to gain traction across the world. Chia (XCH) is one of the leading digital assets in this rapidly expanding market and has already gained huge attention in the crypto market since its launch.

xch long setup ALL trading ideas have entry point + stop loss + take profit + Risk level.
hello Traders, here is the full analysis for this pair, let me know in the comment section below if you have any questions, the entry will be taken only if all rules of the strategies will be satisfied. I suggest you keep this pair on your watchlist and see if the rules of your strategy are satisfied. Please also refer to the Important Risk Notice linked below.
Disclaimer

Chia easy 700% from here!Chia Network (XCH) is a layer 1 blockchain that uses its own custom-designed programming language called Chialisp and a novel consensus mechanism called proof-of-space-and-time (PoST). The combination of these two allows the blockchain to use less energy without compromising network security. In contrast to most other blockchains, Chia Network is a public, for-profit, open source company that aspires to become listed on NYSE or NASDAQ. Its blockchain is aimed at enterprise use, which is why Chia Network plans to have XCH on its balance sheet in case of a listing.
XCH Main trend. 05/08/2024Logarithm. Time frame 1 week (no less is needed). One of the lagging cryptocurrencies. The reason is that the crowd was previously imprisoned thanks to PR by bloggers. Little by little, “faith is being killed.” It is worth paying attention to cryptocurrency, but without fanaticism, observing risk management.
🟡 Secondary trend — the price is still in the range of the accumulation channel, just over 100% of the main set zone.
🟣 Local trend —downward channel. There is a pullback from the channel resistance. Its reversal levels are indicated in yellow. It is also important to break through the resistance of the local downward channel.
📊 Volatility range of trend development now — horizontal channel range levels + fan (partial reference).
📊 After exiting the horizontal channel range (conditional set) — the main focus is on dynamic fan support and resistance zones + partially resistance levels.
This is what it looks like on linear.

XCH /USDT (Chia) Main trend. Horizontal channel 11.6 monthsLogarithm. Time frame 1 week. Main trend.
Maximums trend. False targets.
KuCoin exchange chart. At the peak of pumping, under the bull market hype price was HKEX:1600 (OKX exchange, where there is also a significant volume of trades). This price should not be considered in TA because it was made (more than 2000$) at listing and with super low liquidity. Resistance levels (target sell zones) are marked in different colors for clarity. Remember, the less you set targets in the trading tools (coins), the more you earn at a distance in the market.
The horizontal channel zone (accumulation of almost 1 year).
At the moment of publication, the price has been moving for 350 days (11.6 months) in the parallel horizontal accumulation channel with the step of 108.4%. This is a good sign. The price is now in a squeeze (the average price of this accumulation).
This is what the trend looks like on the line chart.
Stop Loss Zone. Rationality of the strategy.
I would like to emphasize that the stop loss under the support of this accumulation has not been knocked out (reset) at this point. This is not a mandatory action, but it is common. Just keep it in mind and consider it a conditional temporary risk, so to speak. To minimize this contingent risk, use a stop loss or, more rationally, work at an average buy/sell price. Let me remind you again that the price is now clamped with orders on the exchange (it has been there conventionally for 6 weeks) and this is the average price of this parallel channel.
I deliberately showed the percentage values of the main support/resistance zones in case of the price compression (6 weeks in a very narrow range) on the chart for orientation and understanding of the logic of work.
Secondary trend Time frame 3 days
XCH /USDT (Chia) Secondary trend. Channel.

XCH /USDT (Chia) Secondary trend. Channel.Logarithm. Timeframe 3 days Secondary trend. Zone of the horizontal channel.
Zone of the horizontal channel (accumulation of almost 1 year).
At the moment of publication the price has moved in the parallel horizontal channel of accumulation for 350 days (11.6 months) with the step of 108.4%. This is a good sign. Now the price is in the compression zone (the average price of this accumulation).
This is what this horizontal channel zone looks like on the line chart.
Stop Loss Zone. Rationality of the strategy .
I would like to emphasize that the stop loss under the support of this accumulation has not been knocked out (reset) at this point. This is not a mandatory action, but it is common. Just keep it in mind and consider it a conditional temporary risk, so to speak. To minimize this contingent risk, use a stop loss or, more rationally, work at an average buy/sell price. Let me remind you again that the price is now clamped with orders on the exchange (it has been there conventionally for 6 weeks) and this is the average price of this parallel channel.
I deliberately showed the percentage values of the main support/resistance zones in case of the price compression (6 weeks in a very narrow range) on the chart for orientation and understanding of the logic of work.
Main Trend 3 day time frame.
XCH /USDT (Chia) Main Trend. Horizontal channel 11.6M

Chia Halving CountdownHi there?
And here it is a long-waited halving!!! 5 more days
halving.xchia.online
If this does not push the price higher than nothing will do it!
So is it a breakout or fakeout we will know soon!
Good luck holders and traders
