AAPL SELL ANALYSIS SMART MONEY CONCEPT Here on Aapl price from a supply around level of 239.40 and is likely to continue moving down so trader should go for short with expect profit target of 221.87 . Use money management
APC trade ideas

AAPL's forming head-and-shoulders
The AAPL chart image that I drew up is a prime example of where I am exiting my short position and entering a call option.
MACROECONOMICS
AAPL is forming a head-and-shoulders charting pattern, signaling a bearish trend that could be followed by a potential bullish rebound. On Friday afternoon, Mr. DJT announced a 10% tariff on China, in addition to the existing 20% on Canada and Mexico due to the fentanyl issue in America coming from these fucks.
Furthermore, DJT plans to tax foreign entities purchasing GPU chips from American manufacturers. Singapore, which accounts for 15% of NVDA's chip exports, recently reported an increase to 22%, selling an estimated 50k H100 GPU chips (priced at $30k each) to DEEPSEEK. This led to the TECH crash on Monday, causing NVDA to lose approximately $580 billion in market share.
JOBS data reports are set to be released on Tuesday, the 4th, and the numbers are unlikely to be as favorable as last month's. Many large companies worldwide, including BlackRock and Charles Schwab, are laying off thousands of employees. The consumer price index report, released on February 12th, is expected to show an increase from the previous two stable reports. Overall, I anticipate a bumpy February and plan to capitalize on the bearish AAPL trend. If you are purchasing stocks or crypto on your own, and plan to hold long term, set buy limits where equal lows have previously formed. The AAPL chart image that I drew up is a prime example of where I am exiting my short position and entering a call option.


AAPLAAPL price is in the correction period. If the price cannot break through the 258.56 level, it is expected that the price will drop. Consider selling the red zone.
🔥Trading futures, forex, CFDs and stocks carries a risk of loss.
Please consider carefully whether such trading is suitable for you.
>>GooD Luck 😊
❤️ Like and subscribe to never miss a new idea!

AAPL Apple Options Ahead of EarningsIf you haven`t bought AAPL before the recent rally:
Now analyzing the options chain and the chart patterns of AAPL Apple prior to the earnings report this week,
I would consider purchasing the 225usd strike price Calls with
an expiration date of 2025-1-31,
for a premium of approximately $8.30.
If these options prove to be profitable prior to the earnings release, I would sell at least half of them.

AAPL 1.22.2025 IdeaMy assessment is a fair price on the stock of $230 per share. AAPL now sitting at $222.5, I believe there is a high probability for a 5% up move within a few months.
Entry would be favorable if AAPL =< $220. I would enter direct shares here.
AAPL is of those companies that will be affected by tariffs. However, AAPL has benefitted from expanding its services economy. In other words, AAPL is not reliant on iPhone sales to drive their FCF. This opportunity is one for those looking for a discount on a MAG 7. Just be patient! But be flexible and anticipate further disruptions.

AAPL's Today SessionCurrent Market Overview
* Price: Trading around $237.21 with a downward move today.
* Volume: Noticeable volume spike during the recent sell-off, indicating active participation.
* Trend: Breaking below key EMAs and weakening momentum suggests bearish sentiment in the short term.
Key Observations
1. Support and Resistance Levels:
* Immediate Resistance: $243.69 (Recent consolidation top).
* Major Resistance: $248.35 (Gamma resistance and prior rejection level).
* Immediate Support: $230 (Critical Gamma level).
* Major Support: $218.20 (Gamma Put Support, recent low).
2. Indicators:
* MACD: Negative crossover, with histogram showing increasing bearish momentum.
* Stochastic RSI: Extremely oversold (below 10), indicating potential for relief bounce.
* Volume Trend: Higher volume in sell candles reflects strong selling pressure.
3. Price Action:
* Bearish momentum has broken, signaling continued downside risk.
* Current rejection at $240 aligns with increased selling activity.
4. Gamma Analysis:
* Highest Call Wall: $250 (resistance zone).
* Highest Put Wall: $230 (critical support zone).
* Market positioning below $240 suggests a shift to bearish Gamma.
Trade Setups
Bullish Scenario:
* Entry: Above $240 on a retest with a strong bullish candle and volume confirmation.
* Target: $243.69 → $248.35.
* Stop-Loss: Below $238.
Bearish Scenario:
* Entry: Below $236 with increased bearish volume.
* Target: $230 → $218.20.
* Stop-Loss: Above $238.
Neutral Play:
* Monitor price action near $230 for a potential bounce or breakdown.
Conclusion
AAPL is showing short-term bearish momentum, but oversold indicators suggest a relief bounce is possible. Watch $230 for support and $240 for resistance as key pivot levels. Traders should use caution in these volatile conditions and keep a close eye on Gamma levels for directional clarity.
Disclaimer: This analysis is for educational purposes only. Always perform your own due diligence and manage risk accordingly.

Apple Surges 3% in Premarket Amid AI Optimism & Strong ForecastApple Inc. (NASDAQ: NASDAQ:AAPL ) has seen a notable 3.46% surge in premarket trading, defying concerns over declining China sales. The upward momentum follows an optimistic sales forecast, hinting at a resurgence in iPhone demand fueled by Apple's strategic adoption of artificial intelligence (AI) features.
Earnings Outlook
Apple’s latest earnings report revealed a nuanced performance, with robust overall revenue counterbalanced by a slight dip in iPhone sales. Despite a shortfall in China, where revenue declined 11% to $18.5 billion—falling short of the projected $21.57 billion—Apple’s services unit exhibited strong growth, climbing 14% year-over-year to $26.34 billion. This exceeded Wall Street expectations of $26.09 billion, reinforcing Apple’s ability to diversify revenue streams beyond hardware sales.
CEO Tim Cook emphasized that Apple Intelligence, the company’s AI-powered suite of features, is playing a crucial role in boosting iPhone sales where available. However, Apple’s cautious approach to AI investments, unlike its peers such as Microsoft (MSFT) and Meta (META), has insulated its stock from recent market turbulence. The restrained AI strategy aligns with Apple's focus on integrating AI within its hardware ecosystem, enhancing device functionality without excessive capital expenditure on data centers.
The company posted earnings of $2.42 per share on revenue of $124.3 billion, surpassing analyst expectations of $2.36 EPS on $124.12 billion revenue. While iPhone sales, accounting for nearly half of Apple's revenue, declined to $69.14 billion from $69.70 billion year-over-year, the broader growth trajectory suggests a potential iPhone rebound in FY26.
Technical Outlook
From a technical standpoint, NASDAQ:AAPL is demonstrating strong bullish patterns. The stock is currently up 3.41%, benefiting from the renewed confidence in its growth trajectory. Prior to this recent rally, Apple shares had experienced a 15% decline since late December 2024. However, the current price action suggests a recovery, with NASDAQ:AAPL reclaiming 10% of its lost value, forming a falling wedge pattern—a historically bullish signal.
The premarket surge sets up the possibility of a gap-up pattern at market open, a strong bullish indicator that could further accelerate buying pressure. In the event of a pullback, immediate support lies at the 61.8% Fibonacci retracement level, a key level that often dictates price reversals in technical analysis.
The China Factor and AI’s Role in Future Growth
While Apple’s sales slump in China remains a wildcard, analysts expect a recovery once Apple Intelligence is introduced in the region. The lack of AI features has been cited as a major reason for weaker-than-expected sales in the Chinese market. TD Cowen analysts predict that demand could rebound once Apple secures a local partner to facilitate AI integration, boosting sales in a highly competitive market.
Moreover, Apple's performance relative to its tech peers remains strong. In 2024, Apple stock surged 30.07%, outperforming Microsoft’s 12.09% increase but trailing Meta’s impressive 65.42% rise. Apple’s 12-month forward price-to-earnings (P/E) ratio stands at 31.12, compared to Microsoft’s 29.2 and Meta’s 26, indicating sustained investor confidence in Apple’s long-term growth potential.
AAPL Positioned for Further Gains
Apple’s ability to weather market challenges, coupled with its strategic AI rollout, positions it favorably for continued growth. The bullish technical setup, strong fundamentals, and AI-driven sales optimism indicate that AAPL could maintain its upward trajectory. Investors should monitor key support and resistance levels, as well as further developments regarding Apple Intelligence’s expansion into new markets.
With analysts raising price targets and market sentiment improving, Apple’s stock could be on track for a sustained rally in 2024 and beyond.

AAPL Earnings Bearish ContinuationFor the past few trading sessions AAPL has been rejected at 240 with big volume. It is currently consolidating under the .50 fib ratio and a close below 240 signals more downsides for earnings. This is not financial advice but my opinion based on technical analysis.

Apple Silicon: Running Massive AI models### Why is DeepSeek a Game Changer for Apple
** credits to alexocheema on twitter
Apple might not be the first name you think of when it comes to AI hardware, but their silicon is surprisingly well-suited for running massive models like DeepSeek V3 and R1—at a fraction of the cost of traditional GPUs.
#### **How Apple’s M2 Ultra Stacks Up Against the Competition**
Here’s a look at some of the top AI chips on the market and how they compare in memory capacity, bandwidth, and price per GB:
- **NVIDIA H100**: 80GB @ 3TB/s → **$25,000** ($312.50 per GB)
- **AMD MI300X**: 192GB @ 5.3TB/s → **$20,000** ($104.17 per GB)
- **Apple M2 Ultra**: 192GB @ 800GB/s → **$5,000** ($26.04 (!!) per GB)
Apple’s M2 Ultra, launched in mid-2023, is *4x cheaper* per GB than AMD's MI300X and a *staggering 12x cheaper* than NVIDIA's H100. That’s a huge advantage, especially for models that require large amounts of memory.
#### **Why Does This Matter for DeepSeek?**
DeepSeek V3 and R1 are *Mixture of Experts (MoE)* models with a total of **671 billion parameters**—but here’s the trick: only **37 billion** of those parameters are active at any given time when generating a token. The challenge? We don’t know which 37B will be needed in advance, so they must all be ready in **high-speed GPU memory**.
This means system RAM is too slow (resulting in less than 1 token per second), while GPU memory is expensive. Apple Silicon, however, plays a different game. Instead of going all-in on raw speed, it offers a sweet spot—a large pool of medium-fast unified memory at a much lower cost.
#### **What Makes Apple Silicon Special?**
Apple has two key technologies that make this possible:
- **Unified Memory** – Apple Silicon uses a single shared memory pool instead of keeping separate memory pools for the CPU and GPU (like NVIDIA and AMD do). This eliminates the need for expensive and slow data transfers between CPU and GPU.
- **UltraFusion** – Apple’s proprietary interconnect technology that links two chip dies together at **2.5TB/s** of bandwidth. The M2 Ultra is literally two M2 Max chips fused into one, giving it **192GB** of unified memory with **800GB/s** bandwidth.
Now, if the rumors about the **M4 Ultra** are true, Apple will take this even further by fusing two **M4 Max** chips, resulting in:
✅ **256GB of unified memory**
✅ **1146GB/s bandwidth**
✅ **57 tokens per second** for DeepSeek V3/R1 (4-bit) with **two M4 Ultras**
This means Apple users could have **serious AI compute power** at a fraction of the cost of traditional GPU setups.
#### **More Than Just Hardware**
Apple is not just delivering great hardware—it’s also making **big strides in AI software** (which is rare for them).
- **MLX** has made it easy to run machine learning workloads on Apple Silicon.
- **ExoLabs** has successfully **clustered multiple Apple devices** to run large AI models, including DeepSeek R1 (671B) on **7 Mac Minis**.
While it's still unclear which company will dominate AI model development, **one thing seems certain: AI will likely run on American hardware & Apple Silicon**

SHORT AAPL to $230-$225It had its pump. It’s follow the MSFT ALGO DISTRIBUTION. Expect a drop to $225 and then a rally back above the only high to put in a fake rally just to go back to $225 and trap buyers. Then pump again and do it again and then again lol.
I will post that chart next.
I grabbed April $240 puts ITM.


AAPL in M30 Timeframe shown Potential Bullish MovementHello, dear followers!
I've conducted an in-depth analysis of the APPLE chart, and I'm excited to share my findings with you!
Market Analysis:
Current Price: 222.79 (pivot level)
Bias: Bullish
My analysis suggests that the market is poised for a potential bullish continuation. This optimism is rooted in the current market dynamics and the chart's technical indicators.
Trade Setup:
Target: 233.53
Safe Stop Loss: 217.21
To maximize your trading success, it's essential to maintain a disciplined approach to risk management. Ensure that you set a suitable stop loss and define a realistic take profit.
I wish you all the best of luck with your trades, and I look forward to your feedback!
Please take a moment to LIKE this post if you find it helpful!
Also, share your thoughts and insights in the COMMENTS section below!
Happy trading!
Best wishes Tom 😎

AAPL on the Verge of a Breakout! Critical Trade Setups and GammaTechnical Analysis (TA)
* Trend Overview: AAPL has been forming a rising wedge pattern on the 1-hour chart, suggesting a potential breakout. Current resistance lies near $240, with support established around $227.50 and $220.
* Indicators:
* MACD: Showing a bullish crossover, suggesting upward momentum.
* Stochastic RSI: Overbought levels, cautioning traders about potential retracement before continuation.
* Volume Analysis: Increasing volume near the $239-$240 level indicates heightened interest, signaling a potential attempt to breach resistance.
GEX (Gamma Exposure) Analysis
* Key Levels:
* Gamma Resistance: $250 - Highest positive NETGEX, suggesting strong resistance if price nears this level.
* Gamma Support: $227.50, acting as a safety net for pullbacks.
* Options Walls:
* CALL Walls: 57% at $240 and 58.2% at $260.
* PUT Walls: -17.5% at $225 and -32.44% at $220.
* Implied Volatility Metrics:
* IVR: 57.7, indicating elevated implied volatility.
* IVx Average: 40.1, slightly above the norm, highlighting potential big moves.
Trading Plan
1. Bullish Scenario:
* Entry: Above $240 with strong volume confirmation.
* Targets: $244 (short-term), $250 (medium-term).
* Stop-Loss: Below $236.
2. Bearish Scenario:
* Entry: Below $235 on heavy selling pressure.
* Targets: $227.50 (initial support), $220 (secondary support).
* Stop-Loss: Above $239.
Options Strategy
* Bullish:
* Buy 240 CALLs expiring in March 2025 to capitalize on potential upside toward $250.
* Risk management: Exit options if AAPL retraces below $235.
* Bearish:
* Buy 230 PUTs for downside coverage, targeting $220.
* Exit options if AAPL moves above $240.
Thoughts on Direction
AAPL appears to be consolidating for a significant move. The rising wedge pattern and bullish indicators hint at a possible breakout above $240. However, caution is advised as the Stochastic RSI indicates overbought conditions, and price may retest lower levels before continuing its upward journey.
Key Note
Price levels may change with the next premarket session. Traders should adapt to new developments and reassess setups accordingly. If you need updates or guidance, feel free to reach out.
Disclaimer
This analysis is for educational purposes only and does not constitute financial advice. Always do your research and manage your risks before trading.


APPLE What Next? BUY!
My dear followers,
I analysed this chart on APPLE and concluded the following:
The market is trading on 222.79 pivot level.
Bias - Bullish
Technical Indicators: Both Super Trend & Pivot HL indicate a highly probable Bullish continuation.
Target - 233.53
Safe Stop Loss - 217.21
About Used Indicators:
A super-trend indicator is plotted on either above or below the closing price to signal a buy or sell. The indicator changes color, based on whether or not you should be buying. If the super-trend indicator moves below the closing price, the indicator turns green, and it signals an entry point or points to buy.
———————————
WISH YOU ALL LUCK


AAPL: Rebound in Play, but Resistance Looms🔥 LucanInvestor's Strategy:
🩸 Short: Below $236, targeting $228. Breakdown below the 200 EMA could accelerate selling pressure.
🩸 Long: Above $242, targeting $258. A break above this level could confirm a bullish continuation.
🔥 LucanInvestor's Commands:
🩸 Resistance: $242 — A breakout level to reclaim previous highs.
🩸 Support: $236 — 200 EMA acting as a critical pivot point.
Apple has bounced from its support zone, supported by a MACD bullish crossover, but the 200 EMA remains a barrier. A sustained move above resistance is required for further upside.
👑 "Momentum is everything—move before the crowd reacts."

AAPL earnings next ThursdayApple Q1 earnings are on Thursday 1/30 at 4:30pm. Apple (AAPL) reported earnings of 1.64 per share on revenue of 94.93 billion for Q4 ending September 2024. The consensus earnings estimate was 1.49 per share on revenue of 94.48 billion. The company beat expectations by 0.61% while revenue grew 6.07% on a year-over-year basis.
The company said during its conference call it expects Q1 revenue to grow in the low to mid-single digits, or revenue of approximately 120.77 billion to 128.54 billion with gross margins of 46.0% to 47.0%, which calculates to earnings of approximately 2.19 to 2.47 per share.
This long AAPL trade idea is based off SMA200 support at 221, RSI is oversold and it's printing a bullish reversal hammer this morning. Therefore, it's a great long entry position with low risk & high probability, heading into earnings on next Thursday.
Q1 consensus:
EPS = 2.36
Revenue = 124.1 B
SMA200 = 221
Trade idea:
long = 222
stop = 219
profit = 240
Options data:
1/31 expiry
Put Volume Total 10,866
Call Volume Total 25,128
Put/Call Volume Ratio 0.43
Put Open Interest Total 76,428
Call Open Interest Total 126,251
Put/Call Open Interest Ratio 0.61
2/21 expiry
Put Volume Total 3,441
Call Volume Total 11,700
Put/Call Volume Ratio 0.29
Put Open Interest Total 224,398
Call Open Interest Total 315,905
Put/Call Open Interest Ratio 0.71
3/21 expiry
Put Volume Total 2,008
Call Volume Total 12,900
Put/Call Volume Ratio 0.16
Put Open Interest Total 298,306
Call Open Interest Total 317,092
Put/Call Open Interest Ratio 0.94

Apple Breaks Downtrend and Key Resistance Ahead of Earnings...!APPLE has broken the downtrend as well as the important resistance level of 237-238 dollars and currently trying to sustain above it just before the earning report. As investors/traders, we should wait till the earning report which will be available on 30 JAN before taking the trade.

Aapl Retesting resistance here at 237.. I've outlined with circles .. also retesting 20sma... I don't think price breaks back over this area.. my target is 216 gap, maybe lower but the 200sma must be respected. Stop loss over 240 or 50sma
If price breaks back above 242 then I was wrong and 250 is coming

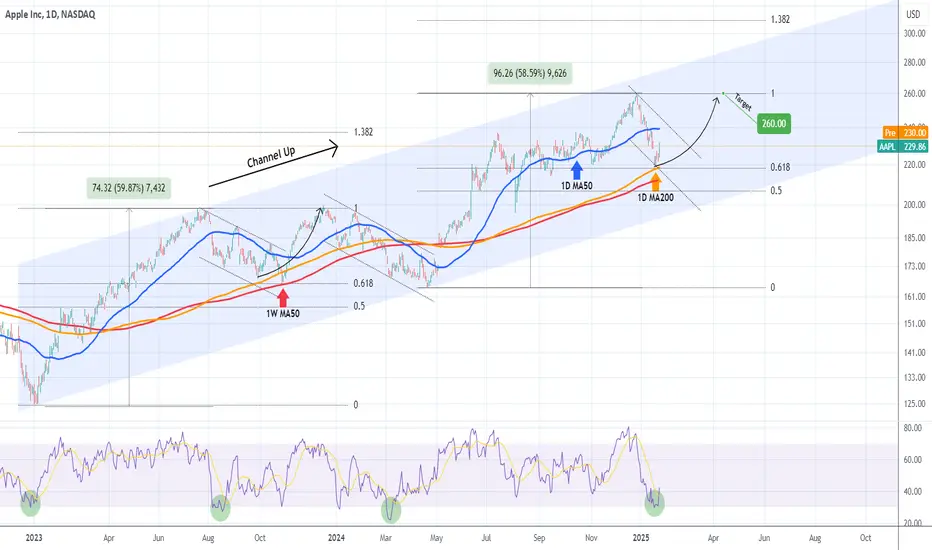
APPLE Strong buy on the 1D MA200 targeting $260.Apple Inc. (AAPL) has been trading within a 2-year Channel Up and the recent correction since the December 26 All Time High (ATH) is its technical Bearish Leg. The price posted a strong rebound yesterday following a test of the 1D MA200 (orange trend-line), the first such contact since May 08 2024.
With the 1D RSI touching the oversold barrier (30.000) and rebounding, this is technically a strong buy opportunity at least for the medium-term, as it's not a direct Higher Low of the Channel Up.
Since December already completed a +59% rise from the April 19 2024 Low, we might be having technically a medium-term rebound similar to the October 26 2023 one that re-tested the High's Resistance (at the time). As you can see both corrections have hit the 0.618 Fibonacci level.
As a result, we treat this as a solid buy opportunity to target $260.
-------------------------------------------------------------------------------
** Please LIKE 👍, FOLLOW ✅, SHARE 🙌 and COMMENT ✍ if you enjoy this idea! Also share your ideas and charts in the comments section below! This is best way to keep it relevant, support us, keep the content here free and allow the idea to reach as many people as possible. **
-------------------------------------------------------------------------------
💸💸💸💸💸💸
👇 👇 👇 👇 👇 👇