LITECOIN (LTC/USD cycle) LITECOIN (LTC/USD cycle)
2013-2024 cycle chart
+ BTC Halving Times
1 Parallel Channel All times
#ltc
LTC/USD
LTC/USD (lineer chart) green buy zones
2018-2023 similarity fractal
LTC/BTC 2013-2024
XLCUSD_LMAX trade ideas

LTC is back into the buy zone but expect lower prices Please refer to my previous litecoin chart years ago. It’s clear we had a rally. We are back in the buy zone again. Anywhere between here and $50 is the buy zone.

Small corrective pattern or completion of larger wave degreeDear Friends,
I hope this message finds you well and that you're having a great start to the week. I wish you success in your business endeavors.
As someone interested in the Elliott Wave principle, I find it a valuable tool for analyzing the market. I have developed my approach by combining this principle with my personal experience and by considering various scenarios that are likely to occur in the market.
I am sharing my analysis with you, but please note that I am not providing any buy or sell signals. I aim to share my unbiased analysis with you so that you can use it as a guide to make informed decisions.
The first analysis is Litecoin
In the attachment, you will find my previous analysis of the same market, so you can compare and see the differences. All the details of my analysis are clearly labeled, making it easy for you to understand (although having a basic familiarity with the Elliott Wave Principle theory will help you understand the analytical idea more easily).
I have been studying the Elliott Wave principle for almost three years now. With time, my understanding of this knowledge and experience has increased. What I have achieved so far is a legacy of a genius named Ralph Nelson Elliott, and I am truly satisfied with my progress. May his soul rest in peace and his memory be cherished.
Thank you for your support so far. I am grateful and will always remember your kindness. Please feel free to share your thoughts and feedback with me.
I hope my analysis will be useful to you in your business journey, and I wish you all the best.
Sincerely,

Enormous LTC fractal and wedge coming to its end2015-2017 the wedge ran till its completion before exploding out into a new range.
since 2018-2024 the current wedge is now nearly complete.
Now if we take a bar chart of the 2015-2017 wedge and expand it and overlay it on the price action within the 2018-2024 wedge it lines up almost 1:1
Exciting times ahead i think

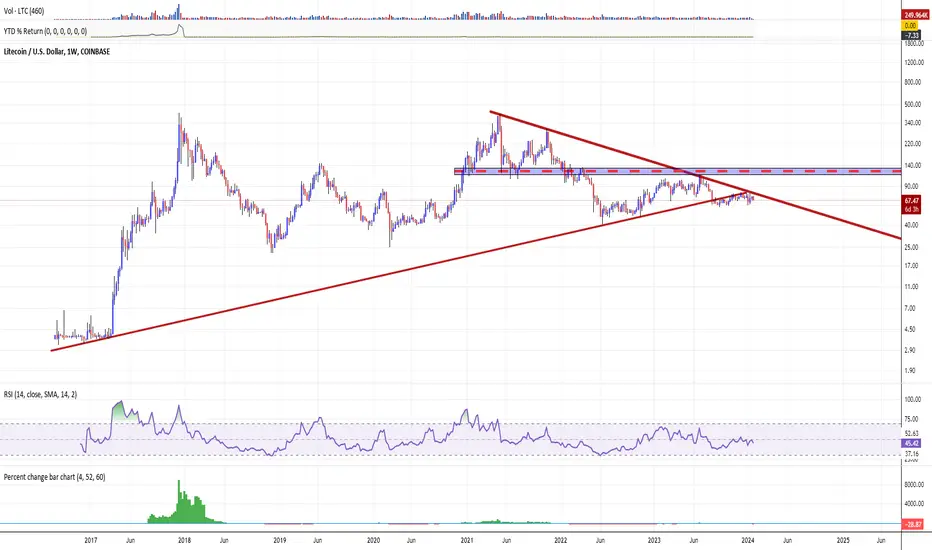
🏃♀️🏃♂ LTC. The spring has compressed. XxX's are inevitableOne of the most anticipated online events in the digital currency ecosystem in H2'23 was the Litecoin (LTC) halving, that took place in early August, 2023.
As the cryptocurrency market prepares for one of the network's major events, the Litecoin (LTC) halving, investors and analysts were peering into the crystal ball of market trends in an attempt to predict the outcome.
However, based on the hype that has accompanied the halving event over the past few months, there is good reason to believe that the online event may produce a different result than expected.
Historical backtest analysis says that every time the number of new addresses COINBASE:LTCUSD exceeded 350,000 over the past five years, a significant price correction followed.
More than 690,000 LTC addresses have recently been created, suggesting that the upcoming halving could be a “news selling” event.
On the other hand, the upcoming Litecoin halving, in theory, provides the opportunity for a significant price increase. This thesis stems from the deflationary effect that halving will cause, reducing the rate of creation of new Litecoins.
Combined with the growing demand for the coin, this again, in theory, could create an ideal scenario for price growth in the medium to long term.
The aftermath of the Litecoin halving should provide the cryptocurrency community with valuable information, especially as investors prepare for the subsequent Bitcoin halving
BITSTAMP:BTCUSD , scheduled for April, 2024.
Technical picture in Litecoin COINBASE:LTCUSD at the same time indicates a continuing deflationary price compression, with possible prospects for a further price decline within the boundaries of a downward channel to multi-year/ historical lows.
CRYPTO | LITECOIN | SELLERS TRENDHello everyone ...
Use good trade management only thing important in Trading is how you manage your trade...
WHAT YOU THINK ABOUT THIS PAIR LET ME KNOW IN COMMENT..
.. good luck..

LitecoinLitecoin is bulish now
If we closs inside the channel
We can expect a great move in next few weaks
Targets
85$
93$
102$
114$

LitecoinLitecoin want to hold in weakly channel
Buy zone 70 72
If we close inside the channel
We can see a great move in few days
Targets are
85$
93$


LTC Long Hey guys how's it going hope you're Fine today I'll share something very special as we can see on the chart of lite coin buyers are looking strong after a liquidation our short-term target is between 80 to 90 dollars manage your risk and enjoy the trade best of luck everyone

Still looks good!The other day I posted a chart with a possible inverse head and shoulders formation in the making. My analysis this morning confirms we are still on track! I have listed 2 shorts term price targets with an expected time frame of early to mid-February. Please remember this is just IMO and not financial advice by any means. Have a blessed day.

Cup and handle forming on Litecoin 4hCup and handle forming on Litecoin 4h
Need to break the falling resistance first
target will be 95$
Eyes on Bitcoin and Ethereum

Inverse head and shoulders formationLitecoin has almost completed an inverse head and shoulders pattern. This is extremely bullish!! Good luck my fellow traders. Anything I post is IMO and should never be taken as financial advise!

How to use Anchored VWAP There's considerable confusion about the practical use of anchored VWAPs. Personally, I leverage them as genuine resistance/support lines due to their integration of volume.
Consider the 2021 LTC top around 397 USD, often perceived as the resistance line prompting many to exit. However, in my Anchored VWAP trading approach, the true resistance stands at 136 USD. A sustained break and successful retest of this updated line indicate potential for prices surpassing the 2021 highs.
Likewise, the 2022 bottom at 43 USD served as support or resistance in various periods, now residing near 75 USD. From my perspective, the current LTC price seems below the prior 2022 lows, suggesting bearish control. I recommend NOT A BUY until we securely close above this price resistance.
Follow for more!

LTCUSDTFrom the data shown on the chart, we find that the price over a period of 73 months forms a higher low than the previous low. On the other side, three correction waves, a large flat, have been formed.. All the data is shown on the chart.. Good luck.

litecoin (LTC)Litecoin (LTC) demonstrates aggressive accumulation. Throughout the year, major players have been buying and continue to accumulate this coin. After the Litecoin halving, we witnessed a logical correction where it paused above a key level, demonstrating a precision similar to that of 2020

LTCUSD targeting 100% minimum This wave targets $154 minimum. It will be reached with no doubts. Just watch ;)

MATIC mimicking LTC. Pullback before blastoff?Noticed a strong similarity between the charts.
If history repeats, buying MATIC at $0.6 with a stop below the lower trendline could offer excellent risk/reward.

LTCUSD 548% profit projectionThis analysis for swinger who look at a good coin to hold for long period,
LTC already reach major support level, we can enter this coin to aim 548% profit projection after halving at $342.78
Rightnow support at $60.
If you are trade futures, make sure your margin level below $34
good luck

LTC may be close to a total collapseCheck your charts comrades, the circumstances are not the same as they were in 2020, DXY is trending up.

LTC Price Analysis: Bullish Surge Targets $100 MilestoneCurrent Rally: LTC exhibits a robust recovery, surpassing the 23.60% Fibonacci level.
Recent Growth: Litecoin experiences a 13% increase, reclaiming the $70 level.
Next Goal: Aiming to breach the $80 mark, potentially catapulting LTC towards $100.
Market Influence: Positive market trends and Bitcoin's potential rise above $50K boost Litecoin's prospects.
Technical Patterns: Rounding reversal and consistent bullish candles signal continued upward movement.
Trading Volume: A notable surge in trading activity bolsters LTC's price trajectory.
Price Trajectory: Litecoin trades at $72.96, showing a promising 1.54% intraday growth.
Key Resistance: The $80 level emerges as a significant hurdle, marking a decisive point for further gains.
Technical Indicators:
RSI: Indicates a strong momentum shift, surpassing key averages.
MACD: Positive crossover underlines growing bullish sentiment.
Market Recovery: Aligns with Litecoin's upward trend, suggesting a sustained rally.
Upside Potential: If LTC breaks past $80, a swift move to $100 is likely.
Bearish Scenario: A reversal could trigger a retest of the $70 support zone.

LTC - we've seen this move beforeCRYPTO:LTCUSD LTC looks like another breakout from a basing pattern. Note that the measured ranges were hit from the prior breakout from the descending trend line.

Litecoin is starting it's waves!!We could see this solid coin start to fly!!
I aim to sell mostly above $100.
I think we could see an Litecoin ETF happen if we get a BTC approval.
NOT FINANCIAL ADVICE!!
