XRPUSD - Curve This is the non log chart and a curve can be obtained through the entire bear market, leading to a swap to a bullish state.
Up from here?
XRPHEDGEUSD trade ideas

XRP is not out of the woodsAbout two weeks ago, we warned XRP would likely test its support near $0.43. However, this has not been the case so far, and XRP moved from around $0.48 to $0.52. Despite this upward movement, we believe the retest is still due to happen. In fact, we would not be surprised to see XRP continue lower than that, being dragged by the rest of the cryptocurrency market. To reassess our view (or even abandon it), we want XRP to break above $0.54 and broader strength in the crypto market. We will update our thoughts with the emergence of new developments.
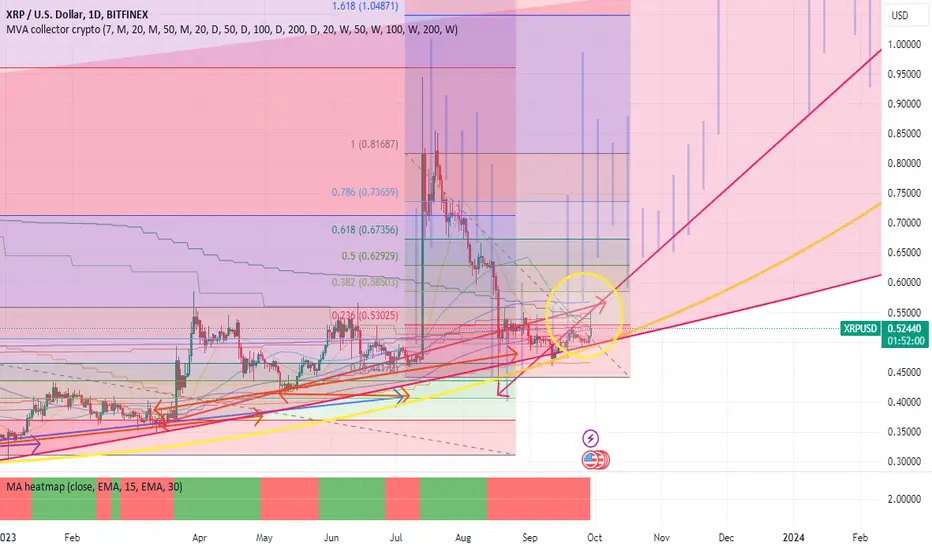
Illustration 1.01
Illustration 1.01 displays the daily chart of XRP and simple support/resistance levels derived from peaks and troughs.
Technical analysis
Daily time frame = Slightly bearish
Weekly time frame = Slightly bearish
Please feel free to express your ideas and thoughts in the comment section.
DISCLAIMER: This analysis is not intended to encourage any buying or selling of any particular securities. Furthermore, it should not be a basis for taking any trade action by an individual investor. Therefore, your own due diligence is highly advised before entering a trade.

Mid Oct. PumpWe saw the XRP proper party pump to 0.55 and retrace back to 0.52 .
Another triangle is seen converging about mid Oct., 10/16/23.

$XRP 4H - 2 trades in oneI took these two longs at the same time. One on the 3m/15m and other on the 4H/1D.


XRP- The start of the endFellas this is the Best Buy area for Xrp right now it’s creating a consolidation base around the .5 area remember it doesn’t need to be a line it’s areas(support/resistance) it did that big move to .55 just a few days ago but came down did a big retrace and now making inconsistent market structure showing slow down of all buys and sells, the reason it’s a great buy is the simple fact it’s at a historic area and the previous sentimental analysis of the court case and newly acquired task for the whole currency industry. We can only see the potential R:R ROI with any method trading holding so how it looks for me is a potential 10:1 ratio trade and return on investment

$XRP has cyclical behavior,CRYPTOCAP:XRP has cyclical behavior,
If following a cycle of 11xx days,
After halving #bitcoin will begin to break out after many months of accumulation.

XRP Price Analysis: Ripple Aims For $0.55 Break To Cross $0.70! XRP price is currently above the 200-day EMA but struggles for a strong closing.
The coin aims to avoid a death crossover and is preparing for a $0.55 breakout.
A breakout above $0.55 could refuel the uptrend and aim for $0.70.
XRP rose sharply by 2.28% on Thursday and continued the trend on Friday.
The coin closed at $0.5217, giving a bullish closing above the 200-day EMA.
The one-day chart shows a sharp reversal but fails to exceed the $0.54 resistance zone.
Two consecutive bullish candles are undermining the previous bearish trend.
The ongoing battle at the 200-day EMA is crucial for the future price trend.
MACD indicators show a bullish trend with rising histograms.
The daily RSI line is above the halfway mark but shows a sideways trend.
A failure to sustain above the 200-day EMA could lead to a retest of the $0.50 mark.
The weekend price movement will be critical for determining the future trend.


Important things to keep in mind with XRP right now.
Significant resistance and support levels to look for in the XRP/USD chart:
Resistance: 0.55000, 0.57423, 0.60000
Support: 0.52423, 0.501672, 0.492541
Resistance levels are price levels where the asset will likely face selling pressure and find it challenging to rise above. Support levels are price levels where the asset is likely to find buying pressure and find it difficult to fall below.
Moving averages (MVAs):
MVAs are a type of technical indicator used to determine an asset's trend. They are calculated by taking the average price of an asset over a certain period.
The chart shows the following MVAs:
7-day MVA
20-day MVA
50-day MVA
200-day MVA
The 7-day MVA is the most responsive to recent price movements, while the 200-day MVA is the least responsive.
MVAs can identify trends, support and resistance levels, and overbought and oversold conditions.
How to use MVAs in trading:
MVAs can be used in a variety of ways in trading. For example, traders can use MVAs to:
Identify the trend: If the price of an asset is above its MVAs, then it is generally considered to be in an uptrend. If the price of an asset is below its MVAs, it is generally considered to be in a downtrend.
Identify support and resistance levels: MVAs can act as both support and resistance levels. For example, if the price of an asset is above its 50-day MVA, then the 50-day MVA can act as a support level. If the price of an asset is below its 200-day MVA, then the 200-day MVA can act as a resistance level.
Identify overbought and oversold conditions: If the price of an asset is above its MVAs and moving higher, then it is considered overbought. If the price of an asset is below its MVAs and moving lower, then it is considered to be oversold.
XRP Monthly time frame look. November PumpShort and sweet.
November 2023 that looks like when XRP will pump based off prior cycles.
I would not be shocked to see XRP heading down to 33 cents range before we enter November which then price begins it's recovery and upward trajectory in Nov.
If someone asked me personally when I think XRP would pump I'd tell them Nov 27th 2023 but it can happen anytime now being so close to a cycle end also another date I looked at based off prior moves is Oct 16th for a pump but I think how price is delivering we may have a red October & November we begin our upward movement finally!
Have your bags packed & Thanks for stopping by!
The vertical blue lines from left to right the dates did not show up so I'm providing them here.
First blue line starting far left is: 11/01/13
3/01/17
7/01/20
and far right is 11/1/23
-Neverwishing

XRP PUMP INCOMMING ?Hello traders ,
xrp formed a inverted head and shoulder indicating a possible bullish pump.
confirmation is break of that yellow level .

little more push please If price pass over 0.55 by this pump, we can move close to 1$ again in next 2 month, otherwise these day profit came from NYC Party and will be cool down again over 50 cent!

XRPUSD This 1day Death Cross is a blessing!Ripple / XRPUSD just formed a Death Cross on the 1day time frame.
This is a bearish technical pattern but last time it was formed (Dec 23rd 2022) the price was forming the bottom of the 1 year Channel Up.
The 1day MACD patterns of the two fractals are very similar.
We consider this Death Cross a strong buy opportunity. Even though one last pull back is technically possible, you can start entering now.
Buy and target near the previous High (0.9000).
Previous chart:
Follow us, like the idea and leave a comment below!!

XRPUSD Bullish ForecastXRPUSD is bullish over the H1 with one price target for a bias of 0.5239. It's an indicator setup, and I saw that the current H4 candle is unstable against the daily candle, but it has a lot of bullish momentum.
If it loses momentum, shifting momentum on the next candle, then 0.5014 is a cautionary area toward the invalidation point.
K.


☄️ XRP CRAZYJUMP! ☄️☄️ Thanks for tuning in as always ladies and gentlemen, this will be short yet concise!
☄️ In yesterday's idea I made the target for us to break 0.5146 and possibly the next level above but it seems like the market had other plans sending us up even further to 0.545 before ultimately reversing. But why?
☄️ There's no news or new developments so this is most likely the result of a short squeeze, that and the fact that volume entered in so quickly goes to show that some whale or institution started a short squeeze which cumulatively knocked out around $2.62 million in shorts bets bringing the total to $3.63 million in the last 24 hours amounting to one of the biggest short liquidations since September began.
☄️ As those short positions get sold and liquidated it helps cause an upside move alongside regular traders or people jumping in upon seeing the spike and taking the chance. That and the fact that the Ripple Party in New York is going down today and there could be some expectations regarding announcements at the party or simply hype.
☄️ This alongside the fact that we are entering into October now, I've told you guys multiple times already this month was just a bad month generally for the market and that we we're looking more towards the next few months and I mean wow, to see a move like this on what's basically the last day of the month excluding tomorrow is wild, not too unexpected but still nice to see in the least.
☄️ Again there's no reason for the spike thus it's likely just a short squeeze and possibly some traders entering in anticipating the slow shift and sentiment change as we exit what is a brutal month historically.
☄️ Said this idea would be short and that's that, If you've been with me this long then chances are you're already holding so you're fine but if you're looking to enter XRP I'd take some caution right now, especially after a big and sudden impulse wave up. We already know and have SEEN just how things commonly tend to go after these big jumps with things usually reversing a bit at least as both bulls and bears get hesitant as nobody's too sure what the next move will be. Below is the 5 minute chart:
☄️ Judging off the 5 minute chart alone can see that we've got the resistance at our 0.53 horizontal level now and unless we we're to break that things look more like we're still set to retrace some more unless we can keep above 0.526 which we've only tested twice so far.
☄️ Either way this is just one of those points to keep an eye and set some alert's if you'd like but again we're looking forward to the future, not the next hour or two. Thanks to those of you that continue to join me on this journey and keep steadfast with me. Appreciate you guys and hope you guys are doing well, thanks for being here, honestly.
☄️ I know I know, short idea, so that's it for today, thanks for stopping by as always, it's been a pleasure and till next, feel free to leave a like and follow, and most importantly, have a great day.
~ Rock '

Proper Party PumpLet's see what happens 9/29/23 !
XRP SEC settlement? IPO? SBI launch? Ripple 10 year anniversary?

Williams Alligator analysis for Ripple XRPUSD 29Nov2020XRPUSD: The green,red,blue line are moving same up direction, thus indicating an ascending tendency, the support line at 0.57366 .
Preferred point in an uptrend, if 0.57366 is still support look for target 0.66640 or 0.78453, and The preferred point in a downtrend, if
0.57366 is still resistance look for target 0.50852 or 0.44338.
This idea should be use between 30Nov-04Dec2020.

XRP Bull Breaker - Alternate View By Popular Request (5:1 Short)My most popular idea by far, with over 70 comments in half as many hours, is this one, which I've revised in order to show the Trend Exhaustion details w/in the AVWAP Array on the 1D chart. Again, if you are a long term Bull, you won’t like it, and yet since I operate by the Steel Man principle, I welcome your toughest questions and chart-based counter-arguments.
As I always, I strive to render my ideas so that I need no words to explain them, although I can (and do) write detailed paragraphs (elsewhere).
Anyways, in the medium term, I expect price to fall to the $0.3785 shown here, which also marks the Point-of-Control from the last major swing low. Price Action already tested the positive 3rd Standard Deviation of the AVWAP from the same reference point, as shown, and will, by degrees, retest the negative 2nd Standard deviation below (+/- $0.22 USD as of this writing).
The stop loss shown here is discretionary and conservative, and should be revised for current conditions if you are considering a short trade. Closer study on lower timeframes may reveal a better entry or stop loss as the chart unfolds over time.
Hopefully this version clarifies a few details for the confused.
In practice, the Trend Exhaustion Wedge reveals stop loss and profit targets for day traders on the lowest time frames (minutes, even seconds), which are, by nature, moving targets on any given day. The AWVAP Array, on the other hand, is dynamic, and prints according to the timeframe, unlike the trend lines.
I intend to start live-streaming soon, so feel free to ask questions if you have any. Critical thinkers only ... XRP-Trolls need not apply.
Until then, be liquid!

☀️ XRP QUICK AFTERNOON TA ☀️☀️ It's been a busy week and I don't have much time right now for this idea so I'm keeping things short but it also doesn't seem like you guys mind the short idea's either, some get more likes and some get less so it varies I suppose but regardless thanks for stopping by.
☀️ It's basically been a bit of a tedious week with us even getting close to retesting that 0.492 it's clear that neither side has really gained control between buyers or sellers which has put us in this uncertain position.
☀️ That being said as of currently and most recently we can see how buyers did manage to pull XRP above that pivot point of 0.50 to where we're at now managing to avoid logging any more losses or slides down. That being said though it's obvious some whales or big entity wanted to sink us by the volume alone, selling volume was huge and that tells me some big bears made a shot but in the least to say, they failed. Especially ones buyers entered and sent us reeling back up.
☀️ What matters right now is that we did end up regaining that 200 EMA and climbed back above 0.50 ultimately. It's not just XRP either. Bitcoin itself is up a whopping $800 today so it's more of a general market boost day, even the general stock market heat map is logging a lot of green for the day so it's just one of those days and oh boy did buyers take advantage.
☀️ I have to go but what matters is whether or not we can keep above 0.50 and hopefully break this resistance at 0.51 which is our next target to break. Support point is 0.50 and current target is to break past 0.51 by which then we'll have to hold there and tackle the next opponent at 0.515.
☀️ I have to go but wanted to get at least something quick out for you guys, sorry it's just been a very busy week but thanks for stopping by of course and feel free to leave any likes or follow, just doing what I can.
~ Rock '

XRP to breakdown?XRP - 24h expiry - We look to Sell a break of 0.4848 (stop at 0.4948)
Trades with a bearish descending triangle formation.
0.4873 has been pivotal.
The bias is to break to the downside.
Mixed but negative price action has resulted in consecutive, narrow-ranged, sideways trading days.
A break of the recent low at 0.4873 should result in a further move lower.
Our profit targets will be 0.4601 and 0.4551
Resistance: 0.4970 / 0.5015 / 0.5050
Support: 0.4900 / 0.4873 / 0.4820
Please be advised that the in formation presented on TradingView is provided to Vantage (‘Vantage Global Limited’, ‘we’) by a third-party provider (‘Everest Fortune Group’). Please be reminded that you are solely responsible for the trading decisions on your account. There is a very high degree of risk involved in trading. Any information and/or content is intended entirely for research, educational and informational purposes only and does not constitute investment or consultation advice or investment strategy. The information is not tailored to the investment needs of any specific person and therefore does not involve a consideration of any of the investment objectives, financial situation or needs of any viewer that may receive it. Kindly also note that past performance is not a reliable indicator of future results. Actual results may differ materially from those anticipated in forward-looking or past performance statements. We assume no liability as to the accuracy or completeness of any of the information and/or content provided herein and the Company cannot be held responsible for any omission, mistake nor for any loss or damage including without limitation to any loss of profit which may arise from reliance on any information supplied by Everest Fortune Group

