XRPUST trade ideas
Xrp Buy zone📊 XRP/USDT Chart Breakdown
1️⃣ Price Structure Overview
* The chart spans roughly from November 2024 to June 2025.
* We observe clear market structure changes:
* BOS (Break of Structure) and CHoCH (Change of Character) labels mark shifts between bullish and bearish trends.
* The current price is consolidating around the \$2.17–\$2.18 level.
* Recent local low at \~ \$2.06 (marked as a strong liquidity area).
2️⃣ Key Levels and Zones
* Demand Zones (Support)
* \$2.06 (strong low marked).
* Grey and blue shaded zones from \~ \$2.00–\$2.18 acting as a major support cluster.
* Supply Zones (Resistance)
* \$2.42 (0.382 Fib retracement).
* \~\$2.85 (0.618 Fib) to \$3.19 (recent weak high) – high probability resistance on rally.
* Psychological resistance around \$3.00.
3️⃣ Fibonacci Retracement & Extension
* The Fib tool is applied from the last significant swing high (\~\$3.22)cto the current local swing low (\~\$2.06).
* Fib Key Levels:
* 0.382 → \$2.42
* 0.5 → \$2.64
* 0.618 → \$2.85
* Full extension → \$3.22
* Price currently testing the 0.382–0.5 range, signaling potential bullish continuation if broken.
4️⃣ Liquidity Zones
* The blue shaded region (\~\$2.00–\$2.18) is a major liquidity zone with strong historical reaction.
* Multiple CHoCH points in May-June indicate a possible trend shift to bullish if price holds above \$2.06 and clears \$2.42.
5️⃣ Market Context
* Daily Structure:Range-bound but with an emerging bullish bias after the \$2.06 low held.
* Current Pattern: Accumulation phase after liquidation sweep below \$2.06, possibly gearing for breakout if market conditions stay favorable.
🏆 Correlation with BTC – Recent 7 Weeks of Bullish Momentum
1️⃣ BTC Context
* Bitcoin has been on a sustained 7-week bullish run, breaking key resistance levels and reaching new 2025 highs.
* This has improved overall crypto market sentiment, leading to increasing altcoin interest.
* BTC Dominance is slightly high but showing signs of topping → good for large-cap altcoins like XRP.
2️⃣ Impact on XRP
* XRP is attempting to reclaim major levels and follow BTC’s momentum.
* BTC’s rally is pulling liquidity into the crypto market, benefiting XRP’s chances of a **breakout above \$2.42–\$2.64.
* If BTC consolidates or slightly pulls back without major weakness, XRP could see a strong move towards **\$2.85–\$3.00.
---
3️⃣ Watch For
* BTC holding above recent highs → more confidence for altcoins.
* BTC correcting sharply → XRP may retest **\$2.06** or lower.
* XRP key breakout: **\$2.42–\$2.64** → if broken with volume, targets \$2.85+.
📈 Summary
✅ XRP is currently in **accumulation mode** above a strong demand zone.
✅ Market structure shows **recent CHoCH indicating potential bullish reversal**.
✅ BTC’s 7-week rally has provided a **favorable environment** for XRP to rally if momentum continues.
✅ Critical level to reclaim: **\$2.42**.
✅ Bullish target if broken: **\$2.85–\$3.22**.
✅ Caution: BTC correction could stall XRP at current support.


Xrp can make a double bottom patternBINANCE:XRPUSDT.P
Xrp is in a bearish channel, if it breaks and complete the double bottom pattern we go to 2.45-2.50$ area which is a double resistance.
When the double bottom completed we can see a retest to do channel, or directly go up.
İf xrp want to go down, we see a movement to channel bottom to 2$ area, which is a double support.

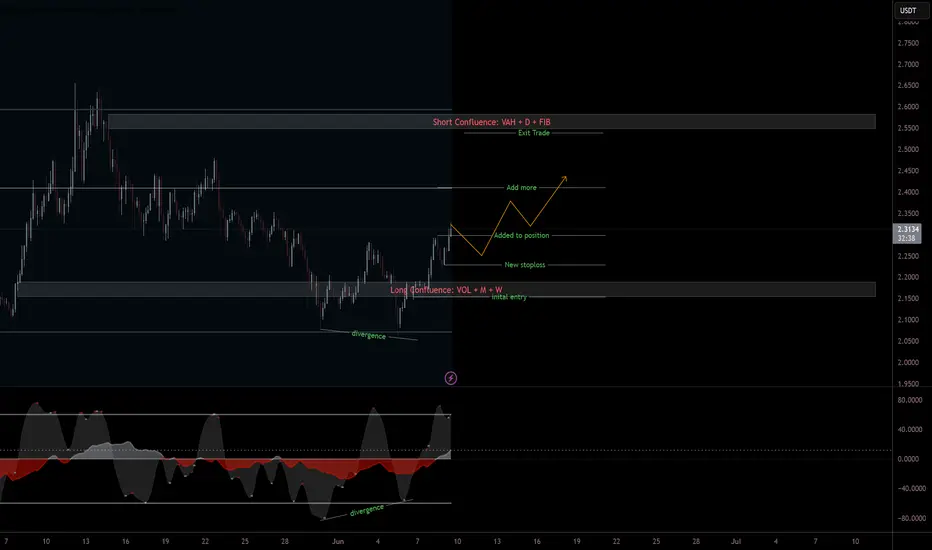
They waited for confirmation. I bought the retrace.XRP didn’t reverse. It refined.
After reclaiming the rounded base and pushing into a 1H OB, price rotated perfectly into the 0.5 retracement at 2.1419 — tagging the breaker wick, respecting structure, and front-running the deeper 0.618 by a hair.
This isn’t weakness. It’s an engineered dip into fresh demand. Smart Money logic doesn’t require “green candles” — it requires imbalance filled and structure respected. That’s exactly what we have here.
Now, price is boxed between two intentions:
If we hold 2.1419, the draw becomes the 1H OB above — 2.1758 to 2.2060.
If we break that level with conviction, 2.1268–2.1052 will serve as the next rebalance zone before any macro continuation.
Execution tier:
✅ Long bias above: 2.1419
🎯 Target 1: 2.1758
🎯 Target 2: 2.2060
❌ Invalidation: Clean 1H body close below 2.1268
Retail waits for signals.
Smart Money builds in silence — and exits with intent.

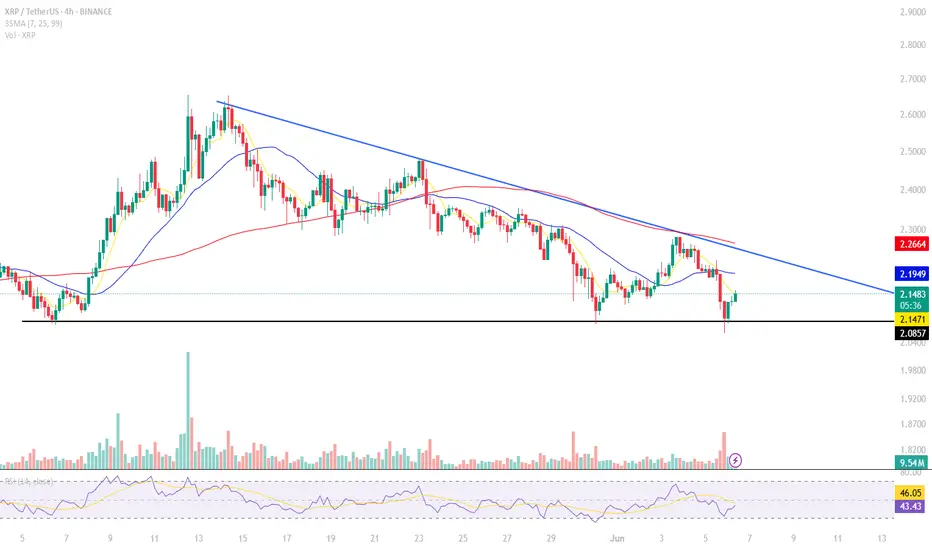
XRPUSDTHi snipers. We are witnessing good news regarding XRP. The price has also grown well in the one-day timeframe and has reached a sensitive point. If it breaks and crosses the (black) moving average line, we will witness another price jump. I am learning and practicing. This is not a trading offer.

IS XRP AT SHORT TERM BULLISH REVERSAL ?The overall trend has been bearish with a series of lower highs and lower lows. Around 2.05 ,2.10, where price previously found support multiple times.Price formed a double bottom / higher low near 2.08, If rejected at 2.22–2.25 zone, price may revisit 2.10 or even 2.05.

XRP Back on the MENU! XRPUSD Ripple next move? XrpUsdtIt's been a while since we looked at this chart.
🌍 SeekingPips 🌎 View remains the same and so we are strictly looking for strategic LONG entry points in
TIME & PRICE. 👌
Yes it's a WEEKLY chart and I understand that many of the trigger happy TRADERS or in some cases GAMBLERS can't stand to look at anything longer than a 30 minute chart BUT really sometimes you really just have to STEP RIGHT BACK to see the BIGGER PICTURE👍
✅️This week's candle CLOSE really has the potential to setup the next few weeks for easy MULTIDAY TRENDING MOVE TRADE SETUPS 👍
ℹ️ Note the price location on what we viewed as a HTF FLAG MANY WEEKS AGO .
Yes it was breached both sides but 🌎SeekingPips🌍 doesn't trade the patterns themselves but the HUMAN PSYCHOLOGY AROUND THESE PATTERNS.🤔
ℹ️ Note where most of the volume has been trading and also note the moves around the extreems of the dead patteren too.💡
In an even higher TIMEFRAME THE FLAG would still be valid and forming the flag itself too.
📊 [ b]CHECKOUT the MONTHLY chart for the example. 📉
Anyway we will see what the next 48 hours🕦 hold but no doubt this one is on our RADAR this week.
✴️ 2.048 to hold otherwise a potential for current low of this year to be tested.
✴️ Alternatively if support starts to form on the 240min chart at current levels last weeks high could expected to be tested
✴️ if so Xrp could easily give a multiday upside trending move.
Now like a NINJA we wait and stalk...
As always ladies and gentlemen whilst Seeking Pips 🌍 SeekingPips 🌎 says
" NO TRIGGER NO TRADE"
& "STICK TO YOUR PLAN"✅️
👍 Have a GREAT WEEK and we will see you soon with an UPDATE...


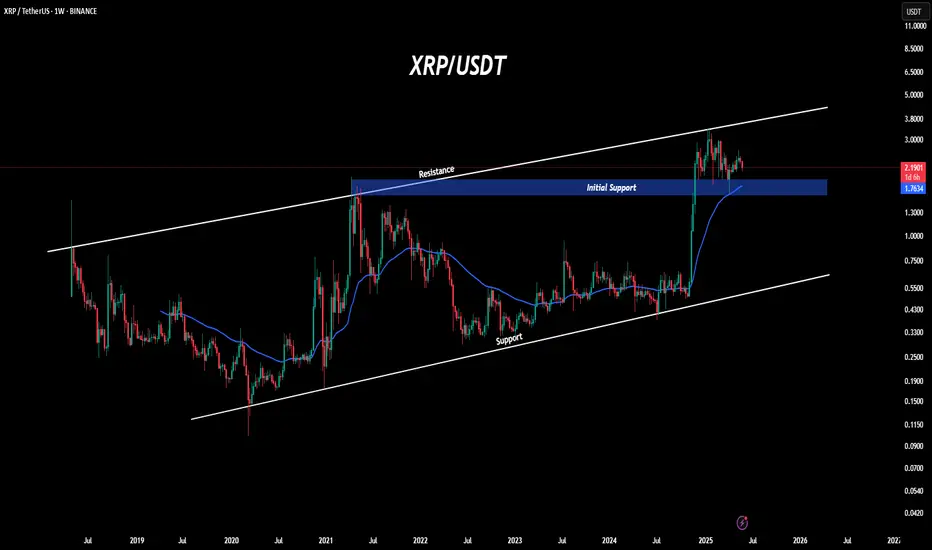
XRP UpdateXRP Weekly Timeframe Update
XRP is currently showing a rejection from the resistance trendline and is now hovering near a crucial support zone, ranging between $1.57 and $1.90. This level is significant as it marks the previous higher high. Additionally, the 50 EMA is providing extra support, from which XRP has already shown signs of a rebound.
Bullish Scenario:
If XRP continues to rebound from this zone, we could potentially see a new all-time high, with the price forming a double top pattern.
Bearish Scenario:
If XRP breaks down and closes below this key support, prepare for downside pressure.
That’s it from my end. Trade safely, and always do your own research and analysis before investing.
Regards,
Dexter
This isn’t distribution. It’s preparation.XRP has spent the last sessions consolidating just under a 15M OB — not failing, just gathering energy. Most traders confuse rejection for weakness. Smart Money sees opportunity.
What matters:
We’ve got stacked 15M OBs above 2.2544 and 2.2805 — liquidity zones that will either break or sweep
Price just tapped the local low while holding above volume cluster support
If we reclaim the midrange and hold above 2.2400, the setup for expansion into 2.2805 is in play
Lose 2.2348? Expect a deeper rotation to the 2.1862 demand zone
There’s no need to predict here. Just follow structure. Volume confirms intent, and the reaction around these OBs will dictate the next leg.
Execution:
Reclaim 2.2544 → long toward 2.2805
Clean breakdown? Step aside and re-evaluate near 2.19
Bias is bullish unless 2.2348 gets invalidated with conviction
You don’t need more signals. You need fewer distractions. The chart is already speaking.
More like this? Setup-first, noise-free — check the profile description.

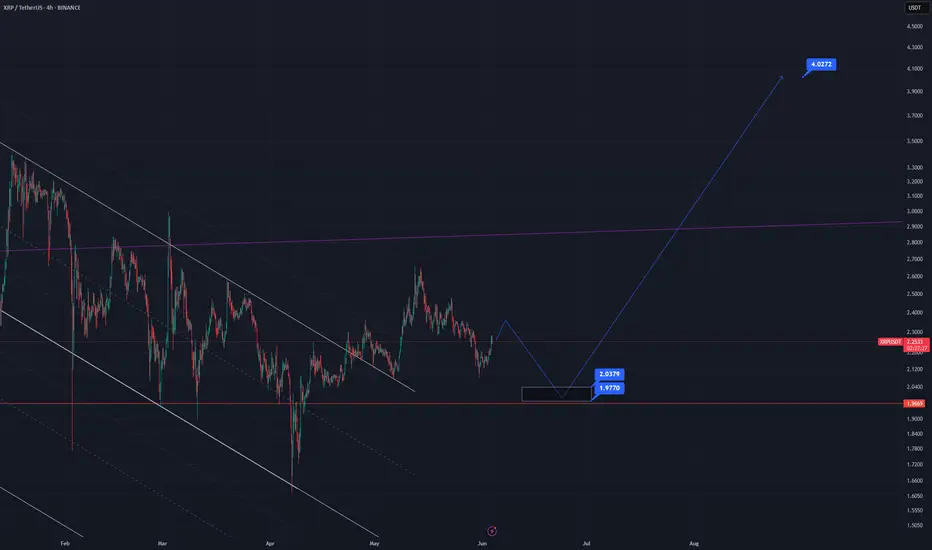
It wasn’t a breakout. It was a sweep.BINANCE:XRPUSDT.P didn’t rally to trend — it rallied to rebalance. The high at 2.2744 was always a liquidity draw, not a destination. Now that the market has taken what it needed, we trade the reaction — not the impulse.
Here’s how this unfolds:
Price tapped into a clean 1H OB and immediately rejected
Below that, we’ve got confluence between OB + FVG zones around 2.2220 and 2.2070 — that’s the re-entry window
Fibonacci levels reinforce the structure:
• 0.5 at 2.2287
• 0.618 at 2.2180
• 0.786 near 2.0266 — last line before deeper rotation
If price holds above the OB and starts to consolidate into a bullish MSS, I expect a rotation back toward the premium wick at 2.2744 — maybe even higher depending on volume profile buildup.
But if we lose 2.2070 decisively, all eyes go to 2.1697 and then 2.1831 — where the real volume sits.
Execution bias:
Accumulation above 2.2070 → bullish continuation valid
Break and hold below? Reversion into deeper discount zones likely
Targeting the sweep of 2.2528 and eventual test of 2.30+ if structure confirms
The move isn’t over. It’s transitioning. You either read the shift or get caught in it.
More setups built on narrative and price logic? They’re in the profile description. I don’t chase — I position.


First, where is the growth target?Hello my friends.
If the Ripple cryptocurrency grows, the first target you can pay attention to is the specified area ($4.50).
Now, in my opinion, it is in a good area for buying.
You can make a step in these areas to buy.
.
.
I hope you have used this analysis well.
You can follow our page to see more analyzes.

About the chart that shows a sideways movement...
Hello, traders.
If you "follow", you can always get new information quickly.
Have a nice day today.
-------------------------------------
When you study charts, you will realize how difficult it is to move sideways.
Therefore, depending on how long the sideways movement was before the big wave, the size of the wave is also predicted.
However, in the charts showing sideways movement, the price range and wave size are often known after the wave appears.
This shows that the location of the sideways movement and the size of the sideways wave are important.
-
Looking at the chart above, we can say that it is showing a sideways movement.
However, since the price is located at the lowest price range, it is better to exclude this chart.
The reason is that if it is showing a sideways movement at the lowest price range, it is likely that the trading volume has decreased significantly due to being excluded from the market.
This is because it is likely to take a long time to turn into an upward trend in this state.
-
Looking at the chart above, the price is showing a sideways movement while maintaining a certain interval after rising.
The sideways movement is about 31%, so it may be ambiguous to say that it is actually sideways.
However, if the price moves sideways while maintaining a certain interval after rising, it means that someone is trying to maintain the price.
Therefore, when it shows a movement that breaks through the sideways section, it should be considered that there is a possibility that a large wave will occur.
The wave can be either upward or downward.
Therefore, it is necessary to be careful not to jump into a purchase with the idea that it will definitely rise in the future just because it moves sideways.
A box section is set at both ends of the sideways section.
Therefore, it is recommended to proceed with a purchase in installments when it shows support after entering this box section.
In other words, it is important to check the support in the 1.5-1.9669 section or the 25641-2.6013 section.
You can see that the HA-Low indicator and the HA-High indicator are converging.
Therefore, if this convergence is broken, it is expected that a trend will be formed.
-
Like this, you should measure the price position of the sideways movement and the width of the sideways movement well and think in advance about whether to proceed with the transaction when it deviates from that range.
Otherwise, if you start trading after the wave has already started, you may end up giving up the transaction because you cannot overcome the wave.
Since it is not known when the movement will start once the sideways movement starts, individual investors easily get tired.
Therefore, when the coin (token) you want to trade shows a sideways movement, it is recommended to increase the number of coins (tokens) corresponding to the profit while conducting short-term trading (day trading).
If you do this, you will naturally be able to see how the sideways waves change, and you will be able to hold out until a big wave starts.
I think there are quite a few people who are not familiar with day trading and say they will buy at once when the wave starts.
If you can hold out well against the wave, you will get good results, but there is a possibility that the trade will fail 7-8 times out of 10, so if possible, it is good to get used to the feeling by day trading coins (tokens) that show this sideways pattern.
-
Thank you for reading to the end.
I hope you have a successful trade.
--------------------------------------------------

XRP's Ending Diagonal: Climactic Push Towards $3.5-$3.8?XRP: Ending Diagonal & Final Push ($3.5-$3.8 Target)
Hello TradingView,
My analysis suggests XRP is in its 5th Elliott Wave, unfolding as an Ending Diagonal. This pattern signals a climactic end to the current bullish cycle, often followed by a sharp reversal.
Key Levels:
Target: $3.50 - $3.80 (marked on chart). This aligns with the diagonal's upper trendline and Fibonacci extensions.
Invalidation: $1.5986 (marked in red). A decisive close below this level invalidates the diagonal structure.
Catalysts: Positive SEC lawsuit developments and Spot XRP ETF speculation provide fundamental tailwinds for this final push.
Outlook: Expect a significant correction after this diagonal completes near its target. Monitor $1.5986 closely.
Not financial advice. Trade wisely.
#XRP #Ripple #ElliottWave #EndingDiagonal #Crypto #TechnicalAnalysis #PriceTarget #Invalidation #Reversal #SEC #ETF #Blockchain #MarketAnalysis #Bullish #Altcoin #TradingStrategy

Xrpusdt 4hr bearishIf it closes below 2.0811 on the 4-hour timeframe, the bearish head and shoulders pattern may activate.
Targets are 1.8 and 1.65.
Invalidation occurs if it closes above 2.2829, assuming it didn't make a new high above that level before dropping down.
It is currently trading below the 100-day moving average.

XRP/USDT at Key Support | Trendline Pressure Builds
ABT is currently testing a strong horizontal support zone around 2.08–2.15 USDT after rejecting from the descending trendline.
This area has held multiple times in the past, showing strong buying interest. If the support holds and price breaks above the yellow trendline, we could see a short-term bullish move toward the 2.30–2.45 resistance zone.
RSI is recovering from oversold levels, signaling potential for a reversal, but volume confirmation is still weak.
⚠️ Key levels to watch:
Support: 2.08–2.15
Resistance: 2.30 and 2.45
Breakout zone: Above descending trendline
I'm waiting for a clear breakout with strong volume before considering long positions.

HolderStat┆XRPUSD rebound renaissanceCRYPTOCAP:XRP bounced off a long falling wedge, logged a labeled “rebound”, and now glides within a widening channel. Multiple consolidation pauses plus higher lows keep momentum positive; watch the 740 USDT overhead zone as resistance where breakout traders may aim next.

XRPUSD broke the Resistance level 2.2080 👀 Possible scenario:
XRP trades around $2.20, a key level. A breakout could lift it to $2.50, but a drop below the 200 EMA risks a fall to $2 or $1.80. RSI is near oversold, hinting at a rebound, though weak volume keeps bulls cautious.
Despite ongoing SEC uncertainty, institutional interest may be rising. BitGo plans a $100M XRP purchase for VivoPower, backed by $121M. Also, Classover (KIDZ) and Solana Growth Ventures launched a $500M crypto fund—a trend XRP advocate John Deaton sees as more than hype. Technicals support a bullish case. 'Charting Prodigy' sees a potential breakout above $2.56, targeting $2.90–$3.40. Egrag Crypto forecasts possible double-digit prices—up to $55—if XRP breaks the 21-week EMA within its long-term uptrend.
✅ Support and Resistance Levels
Now, the support level is located at 2.1400.
Resistance levels is now located at 2.2080.

Price delivered the signal — now it’s time to follow structure.XRP isn’t reacting randomly. It’s responding to engineered inefficiencies and prior OBs that most overlook. What looks like resistance to others is just a staging ground for continuation.
Here’s the play:
Price ran into the 1H OB at 2.2219 — hesitation here was expected
We’re now pulling back into the equilibrium zone, anchored by 0.382–0.618 fib (2.1886–2.1680)
This zone also aligns with the previous 1H OB — an accumulation base that already proved itself
If price holds above 2.1533 and shows rejection at the 0.5 fib (2.1783), I expect the next leg to take out 2.2219 and push toward the 4H OB.
Execution thesis:
Ideal long re-entry is in the 2.18–2.16 zone
Invalidation below 2.1346
Targets: 2.2476 → 2.3107, with 2.2219 as first test
This isn’t about chasing highs. It’s about aligning with structure and letting the draw on liquidity do its work.
Want more trades delivered with this level of clarity? The account description has them. I don’t forecast with hope — I forecast with models.

XRP Repeating 2024 Setup? Monitor the RangeCRYPTOCAP:XRP is once again in a familiar phase — accumulation. After its previous range-bound phase led to a powerful breakout, we’re now seeing a similar structure forming on the weekly chart.
The price is consolidating within a clear range, showing signs of strength but awaiting a breakout to confirm the next move. History suggests this kind of accumulation can often lead to explosive upside — but patience is key here.
📌 Key takeaway: Until a clean breakout occurs, it’s best to observe, not chase. Keep your eyes on the upper range boundary for confirmation.
Let the market come to you.
DYOR, NFA
Thanks for following along — stay tuned for more updates!
