XRP Fundamental Drivers:
Growing institutional interest, including potential ETF approvals, is boosting sentiment.
Macro tailwinds such as a weakening US dollar and easing Federal Reserve rate expectations may support crypto prices, including XRP.
XRP’s role in cross-border payments and partnerships continues to underpin its use case.
THIS COIN HAS FUTURE.
#XRP
XRPUST trade ideas


$XRP ALERTCRYPTOCAP:XRP price is pushing toward breakout resistance!
Don't FOMO in yet — confirmation comes above the red zone!
Break and hold above signals bullish continuation
Rejection could lead to a pullback to the demand zone!
Resistance zone: $2.35- $2.63
Support zone: $1.92 - $2.07
Patience brings profits!

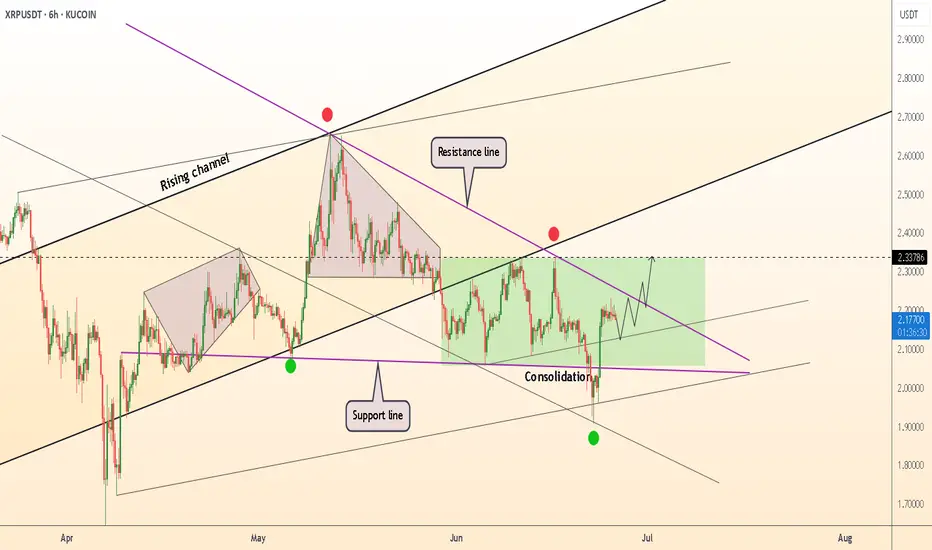
DeGRAM | XRPUSD in the consolidation zone📊 Technical Analysis
● A liquidity sweep to $2.00 closed back inside the six-week green range, printing a hammer on the rising-channel base—confirming the dip as a spring rather than a breakdown.
● Price is compressing against the purple April trend-cap; each pull-back now holds a higher low, and a box-range measured move projects a pop toward the dotted pivot at $2.34 and the channel median near $2.60 once $2.24 gives way.
💡 Fundamental Analysis
● Derivatives funding has flipped positive and cumulative OI on major venues is up ~10 % since 23 Jun, signalling fresh long positioning ahead of July’s SEC–Ripple status hearing.
✨ Summary
Buy $2.10-2.18; breakout above $2.24 targets $2.34 → $2.60. Bias void on a 6 h close below $1.98.
-------------------
Share your opinion in the comments and support the idea with a like. Thanks for your support!
XRP Support Holds After Being Tested 12 Times...Everything below $2 is quickly bought. No crash is good news. Not having bearish action and bearish follow up on sellers pressure is bullish. XRP is bullish and has been consolidating for months. The longer XRP trades above $2, the stronger will be the bullish wave that follows. We are getting very close.
Good evening (morning) my fellow Cryptocurrency trader, I hope you are having a nice day.
The same level has been tested over and over and over since December 2024 and it continues to hold. XRP managed to wick below $2 more than twelve times, this support continues to hold. When prices move lower, buyers quickly show up.
Look at this, before 7-April XRP was moving below $2 very often. After 7-April, only twice. Big difference. This reveals a bullish bias. When the market was bearish, this support was tested more often than not. As soon as XRP turned bullish, it was tested only once recently and once after the 7-April bottom.
This little dynamic here shows that the bulls have the upper-hand and this is all we need to know. Knowing that the bulls have the advantage, when the market breaks it is going to break up. A bullish continuation. It is confirmed and it is only a matter of time.
How long? Only the market knows but it is not far away. The longer it takes, the stronger the bullish wave that follows. Strong growth is likely to develop within days.
Namaste.

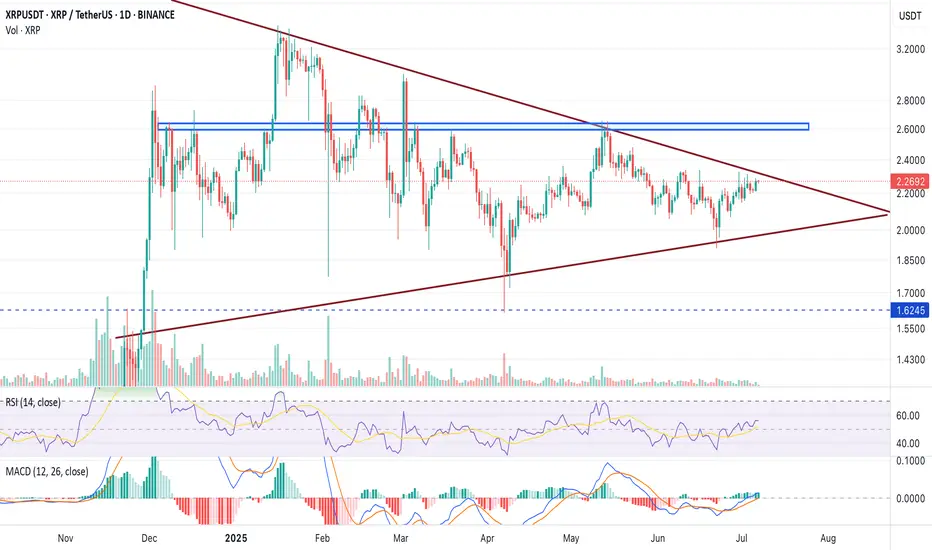
XRP/USDT Poised for Breakout from Symmetrical Triangle!Pattern Identified: Symmetrical Triangle
The symmetrical triangle is a consolidation pattern formed by a series of lower highs and higher lows, converging into a triangle shape. It reflects market indecision and often precedes a significant breakout, either upward or downward, depending on momentum and volume.
🔍 Pattern Description:
Upper Resistance Line (Descending): Connecting the lower highs since February 2025.
Lower Support Line (Ascending): Connecting the higher lows since December 2024.
Consolidation Zone: Price has been moving sideways within the triangle, indicating accumulation.
Critical Breakout Level: Around $2.23 — the price is currently testing this resistance.
📈 Bullish Scenario:
If the price successfully breaks above the upper triangle resistance with strong volume:
Target 1: $2.5855 (previous minor resistance)
Target 2: $2.9534 (key historical resistance)
Target 3: $3.2781
Maximum Target: $3.40 (local previous high and psychological level)
Breakout Confirmation: A daily candle close above $2.30 with significant volume could signal a long entry.
📉 Bearish Scenario:
If the price fails to break out and instead breaks down below the lower trendline:
Support 1: $2.00 (psychological & horizontal support)
Support 2: $1.85
Major Support: $1.55 (strong historical demand zone)
Breakdown Confirmation: A daily close below the lower triangle boundary with high volume would signal further downside.
📌 Summary:
XRP is nearing the apex of a symmetrical triangle — a major move is imminent.
A confirmed breakout could trigger a rally towards $3.40.
A breakdown may lead to a drop toward $1.55.
Recommendation: Wait for confirmation before entering long or short positions.
#XRP #XRPUSDT #CryptoBreakout #SymmetricalTriangle #XRPAnalysis #Altcoins #TradingView #TechnicalAnalysis #BullishCrypto #CryptoSignal


Weekly trading plan for XRPLast week's BINANCE:XRPUSDT price action followed our projected path but ultimately failed to reach the first target. The price now appears to be consolidating in a triangular pattern, so I've outlined two detailed scenarios. While further downside remains the primary expectation, a sharp breakout above the local high would delay the anticipated correction
Write a comment with your coins & hit the like button and I will make an analysis for you
The author's opinion may differ from yours,
Consider your risks.
Wish you successful trades ! mura

XRP | Trade Setup📌 After the breakout from the last high at 2.6, a bullish sequence (green) has now been activated.
📊 These setups typically occur no more than twice per year on any given altcoin, so I’ll be aggressively buying each level at the B-C retracement area.
Trademanagement:
- I'm placing long orders at each level. ((If the price continues climbing, I’ll adjust the trend reversal level (green) accordingly and update my limit orders.)
- Once the trade reaches a 2 R/R, I’ll move the stop-loss to break-even.
- From a 3 R/R onward, I’ll start locking in profits.
✅ I welcome every correction from here on —
but I won’t enter any new positions at these top levels.
Stay safe & lets make money


#XRPI would look for a 1.80 1.90 low but don’t count on dipping much below 2 usd if at all. Set buy targets from 1.60’s up to low 2.00’s like 2.13
As much as I hate to admit it the XRP is truly an army not to mention that chart looks super strong esp with fed rate cuts coming within the year or t least announce a new fed chair

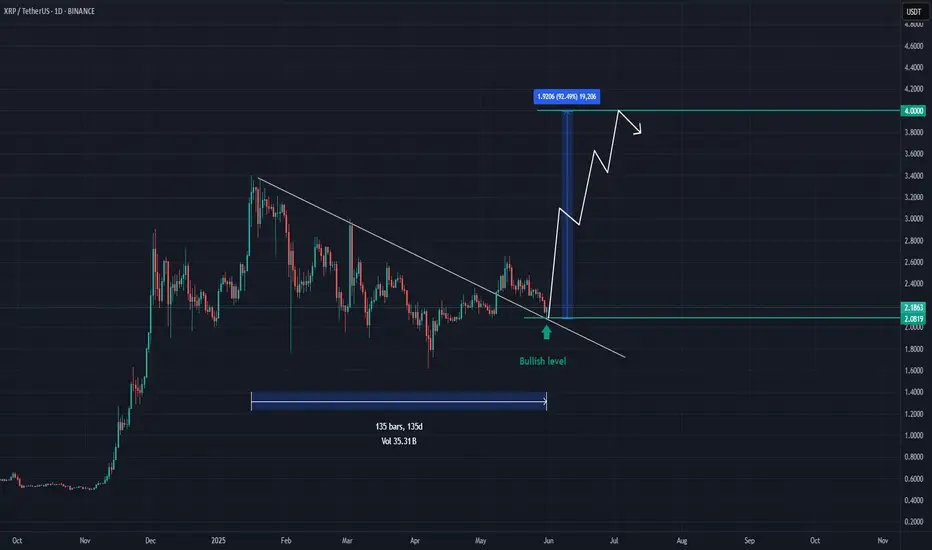
XRP - This is one of many great opportunitiesXRP is reaching a solid level of $2.1.
I believe this level will attract investors for the following reasons :
Technicals :
After breaking the main resistance trendline, XRP is now reaching a solid support level presented in green.
Price action :
- In accumulating since Jan '25
- Resisted to last market dumps
Beyond technicals :
- Very strong community
- Real services and strong team
Market sentiment :
The investors are now looking for a strong asset to invest in. They may switch their alts to any coin that shows strenght. For now, XRP is on the top list.
Recap :
- Risks : bad news from the team , whales dumping , ...
- Main Target : $4
- Reward : near 100%
BITSTAMP:XRPUSD COINBASE:XRPUSD BYBIT:XRPUSDT.P CRYPTOCAP:XRP KUCOIN:XRPUSDT
XRP is making moves!Will it break $3, or drop back to $2? Previous Cycles showed that a correction might be next in line for the crypto market as a whole. Which means, if it happens, altcoins will get affected a lot...Do not get shaken out, after the correction expect a huge rally, but for now...it might be a perfect point to secure some profit.
Not investment advice.
#xrp #bitcoin #crypto #short #analysis
Xrpusdt 4hr time frame bullish iH&SComing from bearish 1st tp area (fib 1.217) from our previous bearish activated pattern " " and now invalidated is a bullish strong move on my POV, as the majority of shorters are taking their profit at the nearest support as sign of fear making a new trend and now formed a bullish ih&s pattern.
Targets are 2.45, 2.6 and 2.8. currently trading above 100 and 200 daily ma which is sign of good bullish move.
Pattern invalidation if closes below 2.15.

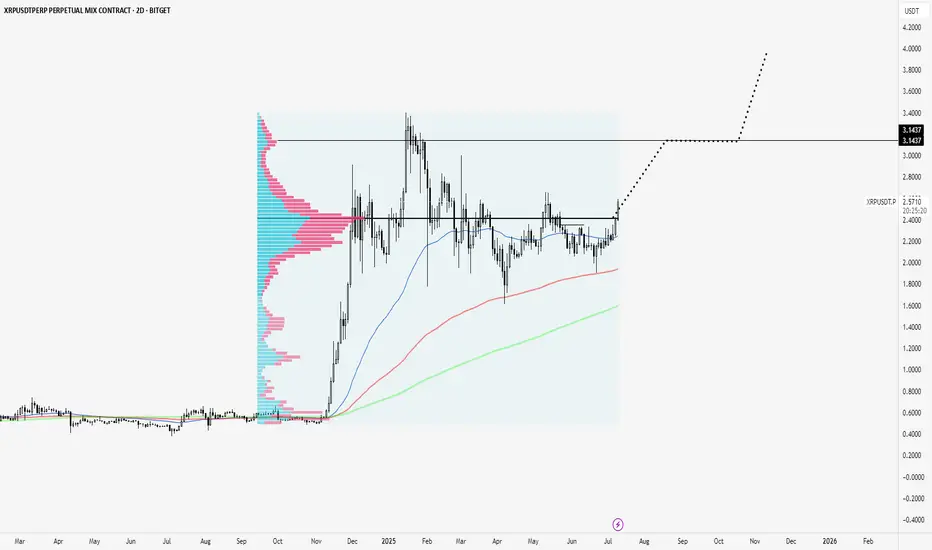
XRP clears Point of Control to test highs.XRP is breaking out of a consolidation zone and above a volume point of control that has been massive since its November rally onward.
Looks like next node is to $3.14
Super strong coin.
Ripple testimony in banking committee yesterday was bullish. Ripple partnering with BNY Melon yesterday was bullish. Ripple leading regulation standards with their XRP case is bullish. Ripple winning the status of XRP as one of a kind is bullish. Ripple getting a bank charter and fed master account is bullish.
Not much is close to XRP fundamentally.
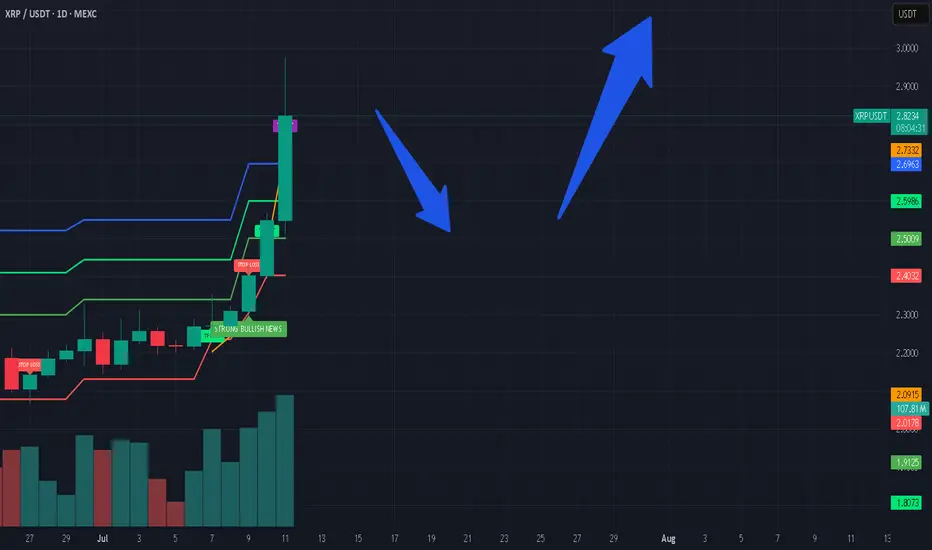
XRP COIN NEXT VIEW Good Day 🌞 Folks i hope all of you are earning well 🥰
Am Still holding my #Xrp🔥🔥 CRYPTOCAP:XRP my next week View on Xrp price soon will jump above $3 so am just holding as of now ❣️🙏🏻 let's see what's next ✌🏻 those who are holding will get great 😃 opportunity to succeed. In below 👇🏻 mentioned chart 📉 you can see my holding trade still waiting for another Rocket 🚀 #xrp


XRP/USDT: Is Ripple Gearing Up for a Breakout?XRP/USDT charts highlight a tightening price structure that hints at a possible breakout. With regulatory clarity emerging and XRP adoption increasing, traders are watching closely. This analysis explores the technical outlook for XRP, including trendlines, support-resistance zones, RSI signals, and volume metrics that may signal XRP’s next major move.
Current Market Structure (as of July 2025)
Price: ~$0.63
Resistance: $0.68 – $0.72 (multi-week rejection zone)
Support: $0.56 – $0.58
Trend: Short-term consolidation in a symmetrical triangle
Volume: Declining, suggesting a pre-breakout phase
On the daily chart, XRP is forming a symmetrical triangle pattern, a classic consolidation setup that often leads to a breakout when accompanied by rising volume. The lower highs and higher lows indicate price compression near the apex.
Technical Indicators to Watch
RSI (Relative Strength Index): Currently near 50 on the daily chart—neutral territory. A move above 60 could suggest bullish momentum building.
MACD (Moving Average Convergence Divergence): Flat, but showing signs of a potential bullish crossover on the 12H chart. A crossover above the zero line would further support bullish continuation.
Volume Profile: Volume declining during consolidation = textbook pattern before a volatility spike.
Look for a volume spike + breakout candle above $0.68 for confirmation.
🔍 Key Resistance & Support Levels
Level Role Reason
$0.72 Major Resistance Previous swing high, rejected 3 times since April 2025
$0.63 Pivot Level Midpoint of the range, near trendline resistance
$0.58 Key Support Base of recent bounce; trendline support
🚀 Bullish Breakout Scenario
If XRP breaks and closes above $0.72 with volume, the next upside targets could be:
$0.84 – Minor resistance from September 2023.
$1.00 psychological level – A key round-number target.
$1.25–$1.40 – Fib extension from the $0.42–$0.72 range.
A move toward these levels could signal the start of a new macro uptrend, especially if fueled by news (e.g., exchange relistings, Ripple partnerships, or legal clarity).
🧨 Bearish Rejection Scenario
Failure to break $0.68–$0.72 could result in a pullback to:
$0.58 support
If broken, next major level = $0.50
Watch for increasing bearish volume on rejection to confirm weakness.

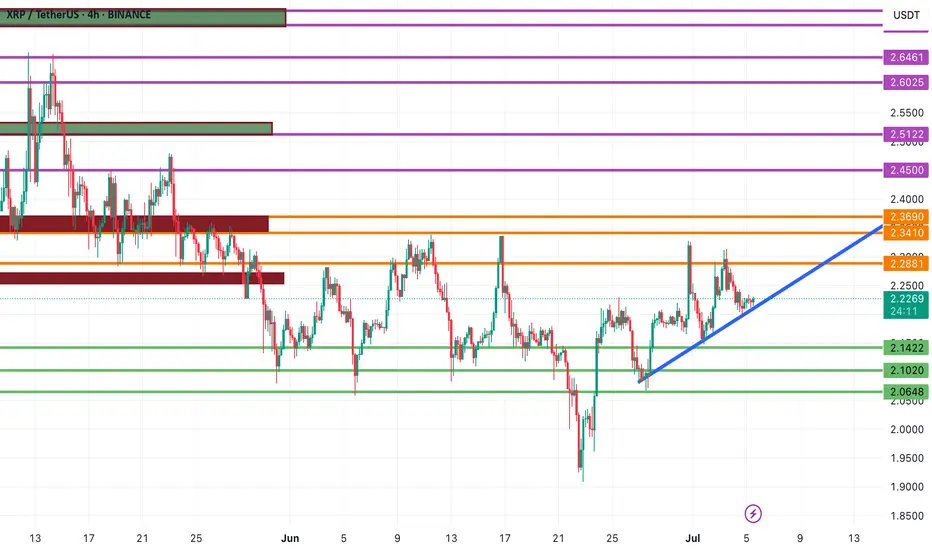
XRPUSDT Technical Analysis – Ripple at a Key Decision Point!🚀 XRPUSDT Technical Analysis – Ripple at a Key Decision Point!
As expected from our previous analysis, XRP has respected the bullish structure and is now hovering right on its ascending trendline. If the price holds this level and confirms bullish signals, a strong upside move may follow.
🔹 Upside Targets:
Key resistance levels to watch are 2.3410 and 2.3690. A breakout above these zones could push XRP toward 2.4500 and then 2.5122.
🔻 Bearish Scenario:
If the trendline breaks down, XRP may revisit previous support zones at 2.1778, 2.1422, and possibly 2.1020.
🎯 Stay tuned for updates – we deliver precise and strategic charts to help you stay ahead of the market.
👉 Follow for real-time crypto insights and smart trading setups!
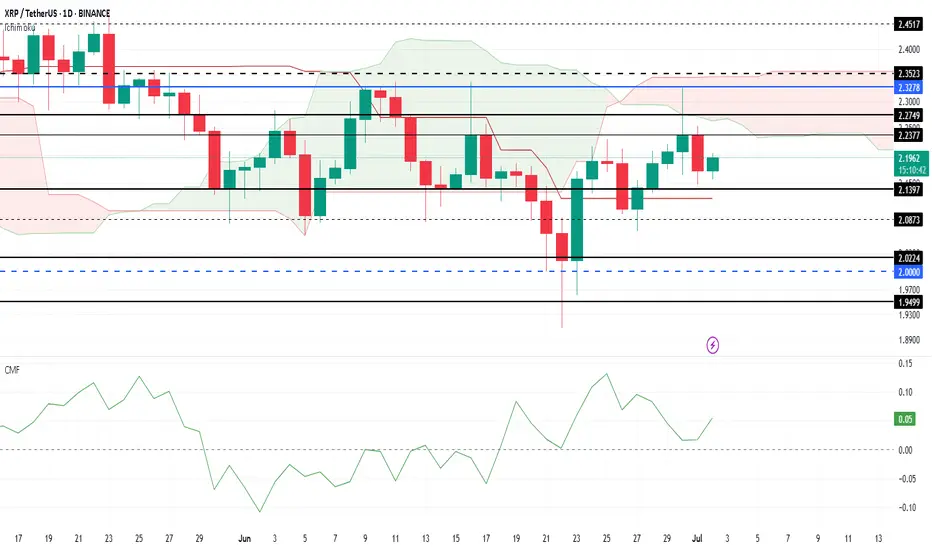
XRP Price Today: Rising Outflows Hinder RecoveryXRP has experienced notable volatility throughout June, with the altcoin failing to break through the $2.32 resistance level. Despite multiple attempts, XRP remains consolidated below this critical price point.
This price action indicates a lack of bullish momentum in the short term, making further gains challenging unless the resistance is breached.
The Ichimoku Cloud is turning negative , suggesting that bearish momentum could intensify for XRP. With the cloud positioned above the candlesticks, it signals further pressure on the price.
Additionally, rising outflows are visible on the CMF, as the indicator moves closer to the zero line, adding to the negative outlook.
If selling pressure continues to mount, XRP could fall below its support at $2.13 , potentially slipping to $2.02. This would mark a significant decline and invalidate the bullish thesis, signaling that XRP’s upward momentum could be at risk in the near future.

HolderStat┆XRPUSD before retest of the $2 levelBINANCE:XRPUSDT has rebounded from its 2.08 base and broken out of consolidation, aiming for the upper diagonal resistance near 2.40–2.60. With recurring bullish patterns and a history of strong follow-through after similar setups, momentum may build if 2.20 is cleared.
