ZIL WEEKLY CHART HAS HIDDEN BULLISH DIVERGENCEZIL weekly chart. This chart is looking bullish. price targets
listed in the blue. This chart formed a nice bull pennant and
with how the RSI has a lower low, this has HIDDEN BULLISH DIVERGENCE.
ZILUSD trade ideas

ZIL bullish linear scale scenarioCurrently sitting on wave 1 parallel channel from previous bull run.
DISCLAIMER ON
This analysis is not financial advice. Please note that you are responsible for your own investments. This chart only represents my opinion and view about cryptocurrency market in general and may be used only for educational purposes.

Zilliqa ($ZIL) FIB and $0.085 TargetZilliqa ($ZIL): $ZIL still holding tightly to $0.07729 FIB resistance and 50MA. The BULL battle is not lost as long as the MACD trends above the signal line and the RSI keep above 50.
What's next for $ZIL to hit $0.085? I would like to see:
1-Close above 50MA and $0.0772 FIB resistance
2-Confirm close above 50MA and $0.0772 FIB
3-50MA crosses over 200MA
4-Close above golden cross 50MA
5-Confirm close above golden cross 50MA
6-Touch upper BB at $0.085

Zilliqa ($ZIL) FIBZilliqa ($ZIL) FIB: You might get lucky. Further weakening of the RSI is likely as the $0.0751 local support looks precarious. If the RSI drip below the mid--line, supported by the crossing over of the MACD, you may get the final fire sale of 2021
LONG ZILLIQA METAPOLISIm very bullish on zilliqa as the network is working to launch a metaverse called metapolin. Im whale-ing zilliqa in my cryptowallet and staking it to eran daily interest on my holdings. WIN WIN. I believe we could see a higher all time high in the month of jan 2022 if they launch successfully and on time. Thanks please like and comment.

Zilliqa ($ZIL) FIB:Zilliqa ($ZIL) FIB: Ok, $ZIL completed the cup and handle and trading above 50MA. What's next to ignite mini-BULL run?
1-50MA crosses over 200MA
2-$ZIL closes above 50MA
3-$ZIL confirms close above 50MA
4-$ZIL Sizeable volume

$ZIL AT SUPPORTzilliqa
at channel support
18 week ma support
stochastic RSI - oversold
possible next wave
1.382 fib = $1.05
1.618 fib = $2.60

Zilliqa ($ZIL) FIBZilliqa ($ZIL) FIB: Potentially playing out the perfect cup & handle. FAs 100% solid. There is no reason why $ZIL can't touch $1 in the near term. $ZIL was slow out the gates but will probably be the strongest finisher. Coins are not meant to go parabolic. $ZIL is proof that the best is yet to come


Zilliqa ($ZIL) FIBZilliqa ($ZIL) FIB: $ZIL finally overcomes $0.0626 resistance into support after testing it 8 times in as many days. Oscillators (not shown due to scale) are improving and there is lots of chatter about #Metapolis

ZIL/USD - Explosive move ahead ?Hello traders and investors,
Today we look at the long term bullish target for Zilliqa. The main idea is based on the concept of wave 3 extension. In this case, intermediate blue wave 1 has been followed from a retracement in the region of 50%, which is one of the possible targets for wave 2 completion.
Assuming that the next impulse and following correction (minor red degree) are the beginning of a new cycle, we should see some interesting targets. Let's see what will be in the next months/years.
And you? Which targets do you have in mind?

the buy area and targets of Zilliqacrab harmonic pattern:
AB=0.61 XA
BC=0.38 AB
1.6 BC=$0.052
2 BC=$0.0738 *third buy point*
0.78 XA=$0.0864 *second buy point*
2.24 BC=$0.0912 *first buy point*
2.6 BC=$0.127
0.88 XA=$0.138
3.6 BC=$0.3
1.13 XA=$0.432
1.41 XA=$1.6
1.6 XA=$4.25 *HODL till here*


ZIL Zilliqa Price TargetZIL Zilliqa Bullish Divergence Chart Pattern!
This is a buy signal.
Price target 0.095usd.
Looking forward to read your opinion about it.

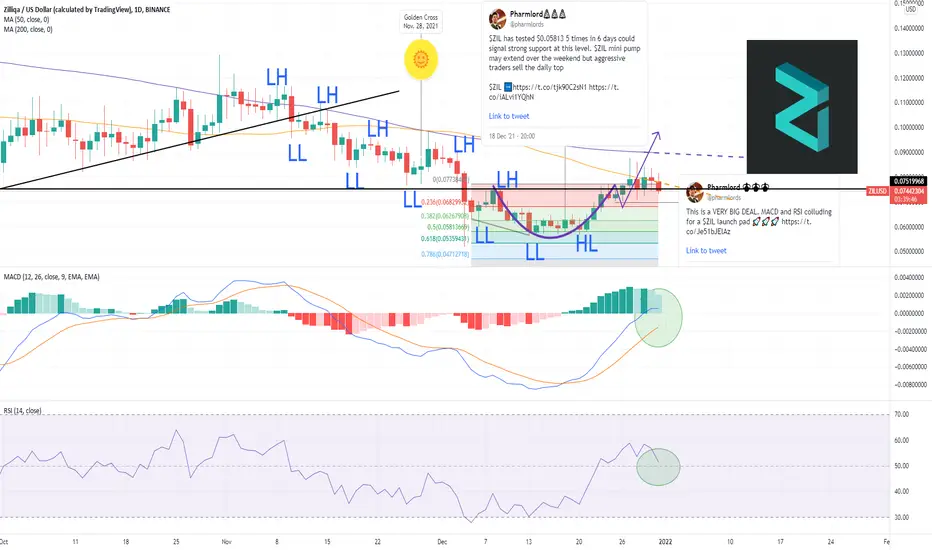
Zilliqa ($ZIL) FIB Zilliqa ($ZIL) FIB : $ZIL mini-pump still in play as RSI and MACD shows good improvement. $ZIL strong support at $0.0535 tested 5 out of 6 D and strong resistance at $0.0626 tested 6 out of 6 D. Consider levels lower than this an even better deal than current prices
OPPORTUNIES EVERY WHERE ZILHello guys, we follow the chart not the news , another accumulation zone to buy and the next buy order is indicated.
Tradehubng

Huge Cup and Handle Pattern on ZilliqaZIL just formed a huge cup and handle pattern on the weekly chart. This pattern only will be confirmed if the price closes a weekly candle above ATH at 0.2355. At first it has to break out from the current descending channel which is the handle of the main cup and handle pattern. The pattern projection is $25! the first targets for the bullish scenario are $1, $4.2 and $6.5. In the bearish scenario supports are 0.029 and 0.014.

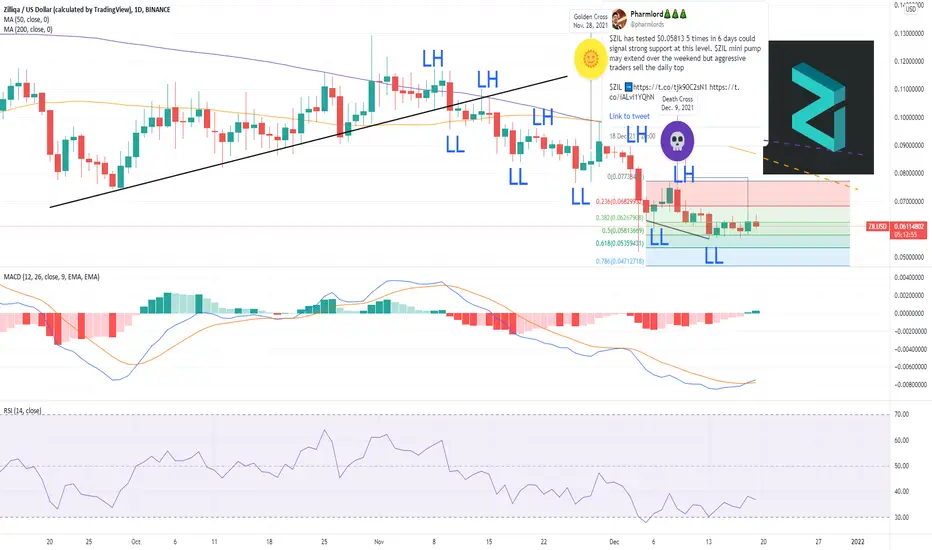
Zilliqa ($ZIL) FIB$ZIL has tested $0.05813 5 times in 6 days could signal strong support at this level. $ZIL mini pump may extend over the weekend but aggressive traders sell the daily top
Zilliqa ($ZIL) FIBZilliqa ($ZIL) FIB: $ZIL RSI is beginning to show real signs of life and MACD looks to improve its trajectory up. DEATH CROSS can be avoided with $ZIL testing $0.0737 resistance on a day with a bit of indecision

ZIL Crypto (Dip Buy Opportunity) - Bearish Shark HarmonicPrice is currently at an entry zone to buy the dip for the ZIL Cryptocurrency.
There is also bullish divergence occuring at the entry zone to support a bullish reaction.


ZILUSD IdeaAn idea suggesting a big moonshot for ZIL
This is based on the previous move to ((2) in green)
A large ascending broadening wedge can be plotted if this bars pattern is placed this way
The placed pattern up is very very speculative, but it really does look bullish above this level
Always make your own assessment. Personal judgement on charts wins every time.

ZIL - Off the Lower BandIn a late Sunday move, grossly undervalued ZIL wakes up and pops off the lower Bollinger Band.
The Stochastic indicator shows ZIL coming out of an oversold sentiment as buyers gobble up the cryptocurrency.
