ZILUSDT.PS trade ideas

Zilliqa /US Dollars (ZILUSDT) Short Selling Chance19/02/2023Technical Analysis:
In this analysis, I adopt an all-encompassing approach that melds Fibonacci retracement and extension levels with Fibonacci Projection, confluence analysis, and the MACD indicator, with a distinct short sell bias for the 30 Minutes Time frame as requested on the assignment, dated on 15/09/2023, 12:55 pm on LinkedIn message section. Additionally, I'll introduce a strategic Dollar-Cost Averaging (DCA) strategy with two scale-in levels. Please refer to the chart for a comprehensive visual analysis:
please zoom out the chart for better comprehension.
Key Technical Observations:
Fibonacci Levels: My analysis meticulously places Fibonacci retracement and extension and levels on the chart, highlighting potential resistance zones and solidifying the short sell bias.
MACD Divergence: Vigilance for MACD divergence patterns remains paramount. (Bearish Divergence) accompanied with (Hidden Bearish Divergence) bolsters the short sell bias.
Strategic Entry Points: I identify key entry points for initiating short positions, at $0.01620 Spot Price at the time of publication capitalizing on price movements in harmony with the overall bias.
DXY is very much bullish which is an other sign that the Total Crypto Market cap may fall and ultimately BTC will dip to the lower prices
the above analysis can show the possibilities of DXY rally
Technical Conditions:
Take-Profit Levels (TPs): To maximize potential gains from the short sell bias, consider the following TP levels:
1st TP: $0.01619
2nd TP: $0.01580
3rd TP: $0.01550
Dollar-Cost Averaging (DCA): I advocate a DCA strategy for scaling into short positions. Start with a partial position at the initial entry point and progressively adding to the short position at the following DCA scale-in levels:
Scale-In Level 1: DCA Price Level 1: $0.01635
Scale-In Level 2: DCA Price Level 2: $0.01650
Stop Loss: Prudent risk management includes placing a stop loss at $0.017 which is above the 0% level of the minor reverse Fibonacci Retracement level, to safeguard against unexpected price reversals.
Trading Scenario:
Short Sell Bias: Given the confluence of Fibonacci resistance, a bearish and a hidden MACD divergence, and strategic entry points, my analysis strongly favors a short sell bias.
Adaptability: Stay adaptable to market conditions, prepared to adjust your strategy in response to any unexpected developments.
This analysis is grounded in historical data, technical indicators, and a clear bearish bias, complemented by a DCA strategy with two scale-in levels. As with any trading strategy, it's essential to conduct thorough research, adhere to your trading plan, and continuously refine your approach as we navigate the dynamic cryptocurrency markets.
I eagerly await your insights and engaging discussions about this analysis, as we explore opportunities in bullish market scenarios!

🔥 ZIL At The Verge Of Breaking Out: New Moonshot SignalZIL has been trading below the top resistance for around 18 months. The 0.0155 support held strong all this time. A break out on either side was expected after the support and resistance converged.
If we can close the week above 0.018, I'm treating it as a successful break out of the triangle pattern. In my view this could be the definite low of this token with much more upside ahead.
It's a risky long-term bet with a very good R/R ratio of 52, which can be a massive boost for the trading balance if it plays out.
As always, patience is key.


🚀 *Bitxer Signal Premium ID#284-3 Target Done🚀 *Bitxer Signal Premium ID# 284-3
ZIL/USDT on Binance Futures (10x Cross)*
📈 *Trade Direction:* Long ⬆️
📈 *Entry Point:* 0.01652
🎯 *Targets:*
🎯 Target 1: 0.01720 🚀
🎯 Target 2: 0.01764 🚀
🚀🚀🚀🚀🚀
🛡️ *Stop Loss:* 0.01627
💰 *Risk Management:* Wallet Size - 3-4% (Protect those funds!)
🚀🚀 Ready to blast off with Bitxer signals! We've got our sights on those targets! 🌠🛸

ZIL/USDT 1H 1HZIL/USDT 1H
If the price holds above the 0.01764 support level and breaks the 0.01823 and 0.01835 resistance, we could see a continuation of the uptrend. However, if the price falls below support, especially 0.01725, we could be looking at a deeper correction, as on the one hand, the RSI suggests that the market may be overbought, which could indicate a correction soon. On the other hand, the MACD shows a buying momentum, suggesting that the uptrend may continue.
Without a doubt, Zilliqa's main innovation is Sharding. By using sharding, Zilliqa divides its network into several smaller parts, called shards, that process transactions and smart contracts in parallel. This allows the blockchain to achieve a high number of transactions per second (TPS) as the network grows, a crucial aspect for scalability.
Good end of the week
🔸Main support levels: 0.01764/ 0.01725
🔸Main Resistance Levels: 0.01823 / 0.01835
➡️RSI: Exhaustion of forces BUYERS
➡️MACD: Buyer
Symbol: ZIL
Maximum supply: 21,000,000,000 ZIL
Consensus: Proof of Work
Released in: 2018
Official website: www.zilliqa.com


ZIL Buy TradeWelcome to our crypto exploration hub! We're here to navigate the exciting world of digital assets, providing you with comprehensive insights into market dynamics and potential trading opportunities.Our mission is to decode the crypto market's mysteries and equip you with the knowledge you need to make informed investment choices. From the latest developments in Bitcoin to the hidden potential of various altcoins, we're your trusted source for daily technical analysis.While technical analysis is a valuable tool, it's important to remember that it's just one piece of the puzzle. We encourage you to take a well-rounded approach to your investments, considering factors like macroeconomic trends, news, and community sentiment.Join us for the freshest analyses, and don't hesitate to join the conversation in the comments below. Keep in mind that our content is purely for educational purposes and should not be construed as financial advice. Always integrate it into your broader investment strategy."

zilusdtzil oh zil... in the initial pattern there is a fakeout pattern which could be a fakeout v2 pattern, where there are 2 resistances in a row and it is broken through with a fakeout, this pattern has at least 2 resistances in a row in the initial pattern more than 2 resistances are better , it's just that in the final pattern you can see the HNS pattern, remember the HNS pattern is almost the same as Quasimodo, but not the same but both can be used for trading. ..and the fakeout v2 pattern can also be used for entry, but the fakeout v2 pattern can also become a fakeout v3, the fakeout pattern usually occurs at the location of the previous fakeout pattern.. this is not a suggestion for trading, so you should research first and analyze before starting trading..


ZIL Trading setup>>>>>>>I Have Tried My Best to Bring the best Possible outcome in this Chart.
TP's and everything's you need marked on the chart.
In case of this scenario happen PLZ set your SL at first .
All important support and resistance's in Short term marked on the chart.
It's Not a financial advise.
PLZ DYOR
With hopping succe


ZIL/USDT Upward Momentum ??? Zilliqa Today AnalysisHello Paradisers, ZIL: A Weekly Perspective
💎Currently situated in a robust demand zone on the weekly chart, ZIL has historically shown resilience and rebounded from this area multiple times. There's a good chance that ZIL could experience a bounce and make its way back to test the supply zone in the medium term.
💎However, should ZIL fail to maintain its position in this strong demand area and close below it, the asset could potentially descend to the Bullish Order Block, where additional accumulation could be considered.


ZIL ANALYSIS (4H)Where I entered "Start of correction" is the beginning of our diametric correction pattern.
What the chart shows us seems to be inside wave E of this diametric.
The green area could be where our diametrical F wave starts and moves up to our red area.
Do not open any position without capital management and stop setting.

#ZILUSDT #LQR #TOBTC #LaqiraProtocolThe price is involved in dynamic resistance. If Break and confirmation, you can open trades up to the scalp resistances in the chart, which are obtained from the intersection of static levels and Fibo levels. On specific resistances, after confirmation, you can open scalping trades. This analysis is a buy or sell offer. Is not


ZIL is in the sweet shopping zone !!!The price is now in the sweet shopping zone 0.02244-0.01370
Purchase level 0.01753
Now is a good price to enter the position!
Local purchase zone 0.02960-0.01528
Purchase level 0.02241
Global Purchase Zone 0.02247-0.01025
Purchase level 0.01615
Volume price 0.02061


ZIL ANALYSIS (1D)Hi, dear traders. how are you ? Today we have a viewpoint to BUY/LONG the ZIL symbol.
zil provides the conditions to enter the upward movement.
It can move up while maintaining the green area.
I specified two tp. It is not necessary to move up to tp 2, but in case of whale attack, it can go up to tp 2
For risk management, please don't forget stop loss and capital management
When we reach the first target, save some profit and then change the stop to entry
Comment if you have any questions
Thank You

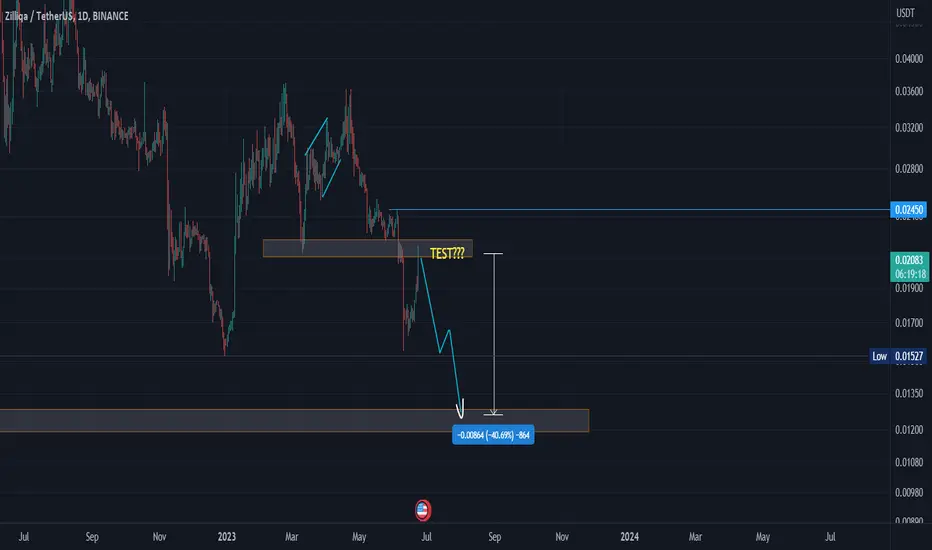
What after the test?From the current general shape, this ascent is nothing but a test of the last broken bottom and closed its predecessors.. Therefore, it will complete a decline again after completing the re-test to the shaded area below.
Note: the analysis fails if the price closes in the highest area 0.0245