AlistairBruce
Not to sound contrarian but UKOG has options to play with and thats going to make the next moves a little tricky to predict. I still believe there will be a bigger pull back but it might adopt some rather unorthodox patterns to get back to 5 or around the 50% retracement level. Ultimatey i'm waiting for price to pull back and establish a value range of types...
I stick with my original plan, while price is ticking along nicely a slight pull back to multiple levels of confluence will give it a good boost higher. Ultimately it's looking steady and good, some near term levels to contend with at 140 but once passed this level, lovely upside. Patience, time to see if the plan materialises and provides a high probility trade...
The recent push up and test of the significant pivot at 0.50 was a welcome bit of positivity in what looks like a relentless downtrend. The longer this deterioration persists the more people leave and use their money elsewhere, so the recent push up on UK electric car commitments seemed to do the trick. However, 0.50 needs to be broken, my original plan to watch...
Currently HSBC is facing a long standing resistance level at 766, this is acted as pivot back in 2008 and 2009 and as resistance in 2013. Price action is faced with a conundrum, try and break from where it is, already relatively overextended and less oppurtunistic for new entries OR correct (retrace) over the next couple of days or weeks to get some momentum from...
Sirius petroleum has recently responded well resulting in steady price movement, okay patterns which are realitivey intuative and moving averages which are positively alligned. A combination of new highs, followed by a noticeable near term ceiling at 1.30 and a good trend line supported by high lows (even if they are not pretty). This presents a crunch which may...
Good narrow price range with symmetrical pattern strangulation may stimulate some moves to the upside. Typically the price action pattern is not a reversal pattern so positive projections need to be concidered. Look for strong pushes to the upside breaking 0.35 followed by test of the next logical high at 0.50 area. There may be some shallow price challenges...
A 5 month narrow range has prompted my attention - a completely out there speculative scenario. This share has tanked fom great heights until March where it has been hovering around between 0.06 and 0.11 = equilibrium. Now i don't need to do the maths to tell you if this comapny posts a recovery story it will respond like a bomb, 3.79 the next logical resistance...
The difficulty here is that price is doing what we more or less had planned with the exception that the RSI is not confirming strength and conviction of the move as yet. Still good buy potential - depending on your strategy a close above the 0.17 would signal a breakout buy and the next target level would be 0.27. This would be a significant level to move higher...
Amur Mineral Corporation has been a strong contender for big potential for many years. Historical highs of 40 have given an indication of what sort of momentum is involved when the news goes its way. Over the past 3 months price has been comfortably ranging between 6 and 7, the recent breakout warrants some attention. Look for price to pull back slightly after a...
KDNC has all the "hype" potential with none of current technical's to support it. The company has lots of support in followers and lots of shares in circulation all chasing the next big thing - Lithium boom. With great reserves and vested interests the company is in a good place except for cash flow, it doesn't own anything. So - Look for big moves up after news,...
REVISED PLAN - Currently a little pull back just below the 0.17 price pivot and key level to be broken. Look for pull back to bounce of near term support pivot at 0.13 (area), then a strong move up would be preferred with a good close above the struggle level. look for RSI to confirm break and close above 0.17, this would help to confirm the strength of the move,...
A lovely mixture of topping patterns - Complex head and shoulders, triple top and rolling top. All supported by a divergent RSI across the full length of the structure. Price ready for potential bounce of neckline, then watch for failure to make new highs, strong selling to convincingly break neckline and then good downside target levels at 38.2 and 50% Fib retracements.
SRES is testing a strong pivot at 0.19, at the same time an increase in volume may indicate support to break through this long term level. Should the level break with supported volume and momentum (RSI indicating overbought) the there is potential for a push to 0.25 followed by a shallow pull back before moving significantly higher. The next logical target level...
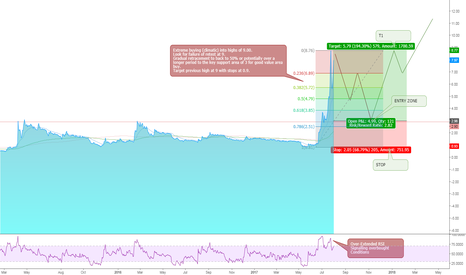
Climatic buying into top at 9 may result in a run out of steam as commitment burns out and the price does not offer much more value resulting in a gradual pull back (time, news and economics dependent) which may offer a good entry at the 50% retracement. Should it move deeper a more significant level at 3 which was previously strong resistance would work as a good...


