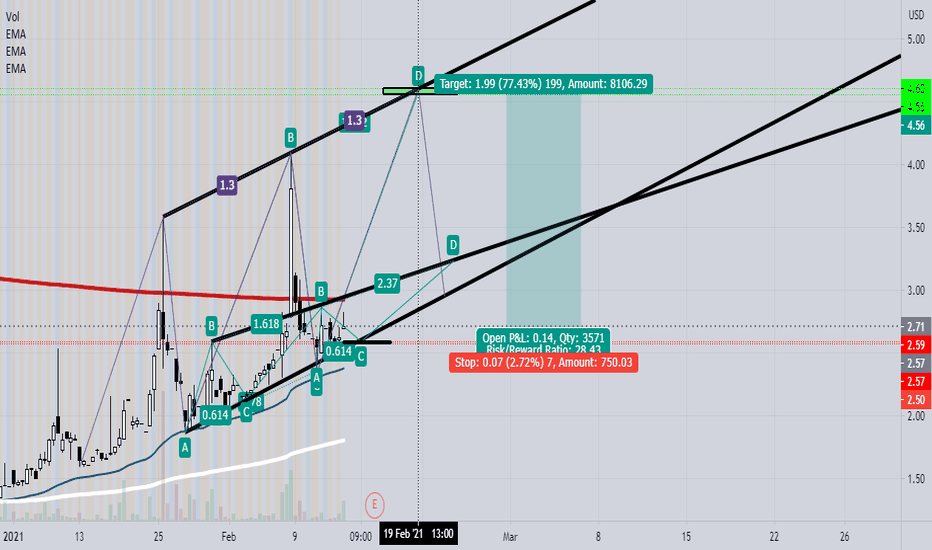
Trawling for some cheap shares. Check it out and load up!
Trawling for some cheap shares. Check out the chart and load up!
One of many harmonic trades on this chart. I'll post the further charts below.
I am predicting another 3-drive spike corresponding to a bearish butterfly pattern located on the chart. I attempted to locate the most preferred entry point using previous price movement intermediate between spikes, as indicated by ABCD ratios and the previous bullish gartley pattern that preceded the most recent spike. Unfortunately, this gave a rather large...
Entry at the 0.618 Take-Profit level of the daily chart bearish crab is a safe point to maximize returns on the bearish butterfly that has formed on the weekly chart. I will post the bearish butterfly chart below.
If the BC leg forms as shown, then we can expect a nice and quick trade from the D point to our take profit levels. RR = 16:1
Currently, this is where we stand on RIBT. I'm hoping for lower time frame details to emerge and shed light on trade opportunities in the near-term. On the 4 hour chart or lower the bullish gartley exists, while on the daily or higher the absence of premarket data reveals the story of a bearish butterfly. Either way, one cannot deny the appeal of that entry at...
Read the chart!!!
Many of the small market cap, low share float tickers are experiencing huge volume spikes. Therefore, the prediction is a 3-drives pattern at 1.272 fib extension of the previous drive and low between the spikes, since this appears to be the common thread among these tickers. See chart for more details!!!
Since price never broke the 0.382 fib level at the B point, the harmonic can be either a bat or an alternate bat pattern. My money is on the alternate bat pattern with a completion at 1.13 fib level. A solid entry would be between 2.17 to 2.31, if you are lucky enough to get in that zone. There are two price targets along the possible CD leg of the harmonic. ...
Just like many of the other small-cap stocks currently, there's what appears to be a bat harmonic. This could morph into an alternate bat harmonic or blow passed these areas, revealing a three-drive pattern that seems to be emerging with many of these stock types. Either way, it's a good CD leg trade. See chart for entry zone and exit zones.
Using the bottom trendline, we can place a trendline along the top of the graph. Using the left-handed spiral time series in bars before each reversal area {11, 22, 33, 55}, presented in my past xop idea, and a harmonic starting before the crash and through the first two vectors, we find that the top and bottom of the trendlines at the next two time zones...
As you can see, the initial wave top uptrend high from the march low was reversed at 56 bars. The next movement from the june high to the july low was 32 days (23 bars). The following movement from the july low to the august high was, again, 32 days (22 bars). Both 32 day movements were a part of the redistribution phase of a price correction in XOP's...
When SNP touches a value of 36, we can expect a downtrend reversal and long-term uptrend. I expect this to take a few more weeks. We will look for price and time targets when this occurs.
JMIA has recently gone into over-bought territory to an absolute extreme, not seen by any other stock on the market currently. Not only that, the 10 ema is above the 50 sma and the 200 sma is below the current price. From this, we can see price will be driven downwards to meet a better agreed on price range. This will result in further down trending...
If you have any questions, let me know. I am too tired to try to explain the thought process here. I'm hoping you will understand this analysis, based upon what you can see and read. The first target is expected around 90 days from now, while the second target is expected around 190 days from now. Buy: 0.5899, Sell: 2.1099 and 2.699, Stop Loss: 0.5600.


