Fahad-Rafique
Price is in a trending phase, consistently printing higher highs and higher lows, with no divergence on top and a bounce from trendline we can hope for another leg up as per Dow theory. Targets are mentioned on the chart.
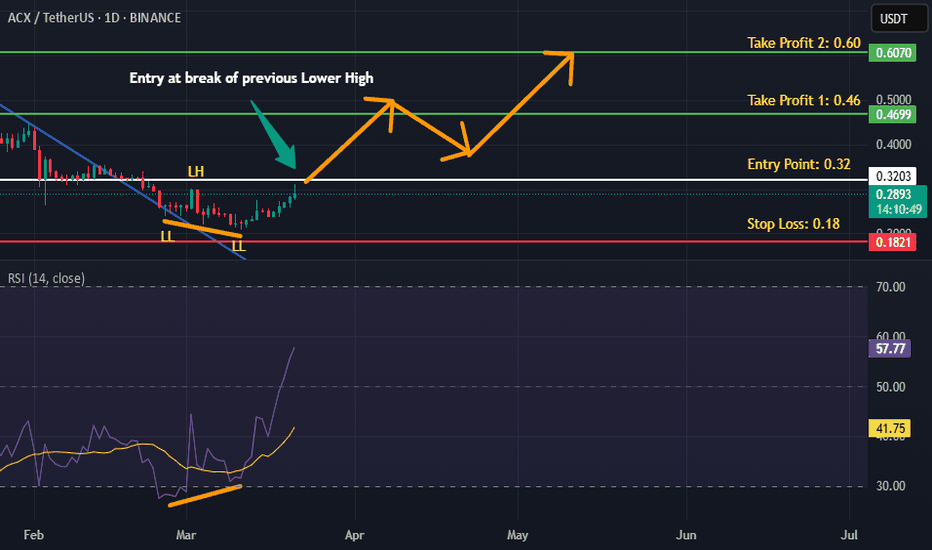
Price was in a strong downtrend, however a bullish RSI divergence has emerged on daily time frame, hinting the return of bulls. If previous lower high is broken with good volume then we can expect a good bullish rally as per Dow theory. Targets are mentioned on the chart.
Price was in a downtrend, however it has given a breakout from the descending trendline and bulls seem to be in the driving seat now. If previous lower high is broken with good volume then we can expect a good returns as per Dow theory. Targets are mentioned on the chart.
Price is in an uptrend, and has printed a higher high, it has also retraced to 0.618 printing a potential higher low, Moreover, it has also tested the 4 month old descending trendline. According to Dow theory, it would now go on and print a higher high. Targets are mentioned on the chart.
Price is in an uptrend, and has printed a higher high, it has also retraced to 0.618 printing a potential higher low. According to Dow theory, it would now go on and print a higher high. Targets are mentioned on the chart.
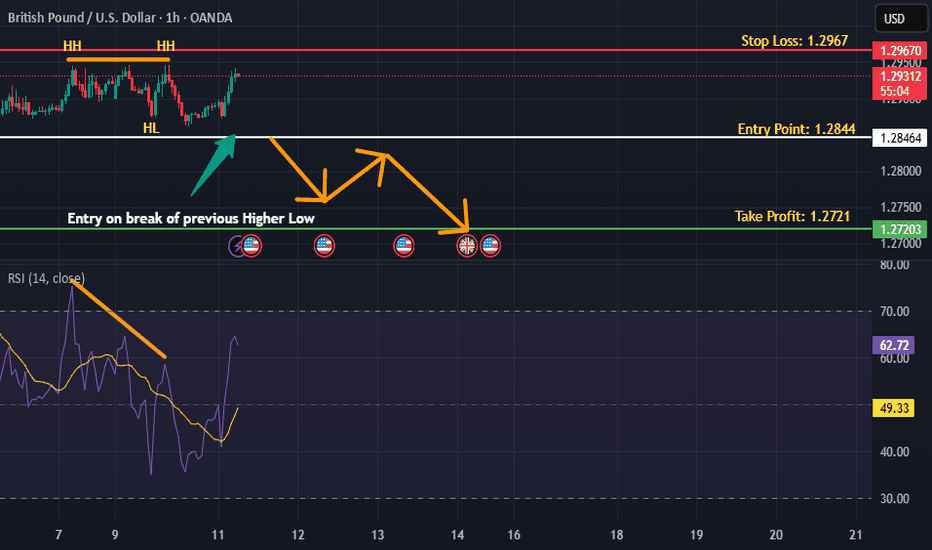
Price was in an uptrend, however the bulls seem to be exhausted now. Bearish RSI divergence with a double top pattern is a strong indication of bearish control over price action. If previous higher low is broken then we can expect a bearish reversal as per Dow theory. Targets are mentioned on the chart.
Price was in a strong downtrend, however a bullish divergence alongside a double bottom reversal pattern has emerged on daily timeframe, hinting the return of bulls. If previous lower high is broken with volume then we can expect a bullish rally as per Dow theory. Targets are mentioned on the chart.
Price was in a strong downtrend, however a bullish divergence along with double bottom hints the takeover of bulls. If price managed to break previous higher high with volume then we can expect a bullish rally as per Dow theory. Targets are mentioned on the chart.
Price was in downtrend, and after some accumulation looks good for take-off. If previous lower high is broken with good volume then we can expect a bullish reversal as per Dow theory. Targets are mentioned on the chart.
Price was in a strong downtrend, and it seems that the bottom is in for NAS100, as a double bottom reversal pattern along with bullish divergence has emerged on four hourly time frame hinting the arrival of bulls to the scene. If previous lower high is broken with volume then we can expect a bullish rally as per Dow theory. Targets are mentioned on the chart.
Price was in an uptrend, however now it seems that the bulls are exhausted and a price reversal might be on the cards following the emergence of bearish divergence and double top pattern. If price breaks previous higher low with volume then we can expect a downside in price action as per Dow theory. Targets are mentioned on the chart.
Price was in a strong downtrend, however a matured bullish divergence on hourly time frame hints the return of bulls. If both previous lower highs mentioned on the chart are broken then we can expect a bullish reversal as per Dow theory. Targets are mentioned on the chart.
Price was moving in a downtrend, however a strong bullish divergence with double bottom pattern has emerged on daily timeframe hinting the return of bulls. If previous lower high is broken with volume then we can expect a bullish reversal as per Dow theory. Targets are mentioned on the chart.
Price was in a steep uptrend, however the bears seem to have taken control of the price action as previous higher low is broken successfully, if the selling pressure continues we can expect a bearish rally as per Dow theory. Targets are mentioned on the chart.
Price was in a strong uptrend, however a bearish divergence on hourly time frame hints the return of bears. If previous higher low is broken successfully then we can expect a bearish reversal as per Dow theory. Targets are mentioned on the chart.
Price was in a downtrend on daily time frame, however, the months old descending trendline is broken, hinting the return of bulls. The notion is further validated by the emergence of a bullish divergence along with a double bottom reversal pattern. If previous lower high is broken successfully then we can expect a bullish reversal as per Dow theory. Targets are...
Price is in an uptrend, however the bears seem to be assuming control of the price action as a bearish divergence along with a double top pattern is printed, hinting bearish control. If previous higher low is broken successfully, then we can expect a bearish reversal as per Dow theory. Targets are mentioned on the chart.
Price was in a downtrend, however now it seems that bulls are trying to assume control of the price action as bullish divergence has emerged on both hourly and four hourly time frames. If previous lower high is broken successfully then we can expect a bullish rally as per Dow theory. Targets are mentioned on the chart.


