Guys I discuss this in detail in this weeks Forex Market Preview. youtu.be If you're not a subscriber you can do so here: www.tradeempowered.com Thanks and talk to you soon!
Great spot to look for a reversal play. Up against structure with a great stop areas.
This is a trend continuation trade on the GBPUSD. We've made a serious down move off the weekly structure resistance area I outlined a couple weeks ago. There could be some additional downside and this gives me some excellent risk/reward
I posted this several weeks ago when the market was trading around 1.3600 We hit the long entry a couple days ago. I've tried a couple times to buy up the EURUSD and it's been very weak. That happens frequently when you're picking tops and bottoms. The benefit is that you tend to have small losses. There is a rather wide reversal zone here as outlined in...
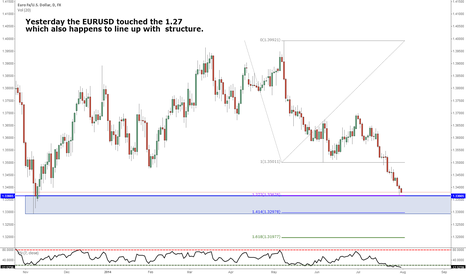
EURUSD touched the 127 yesterday. This lines up nicely with some key structure looking left. RSI is way oversold at around 12.
This pattern filled this morning and is not sitting around break even. Still chance to get on the move.
If you don't already know these basic candle patterns it's worth learning them. I have been thinking about doing a short training series on these and potentially doing some simple indicators to identify theses setups. If you'd be interested in learning about these setups hit the "Like" button. In order for this pattern to be a valid sell the three green candles...
This Gartley completion lines up with a major structural shelf on the Daily chart. Try as it may USDJPY has been unable to make a move lower.
As you know I put out a buy on EURUSD on Friday. Market dipped and triggered my stops along with quite a few others I'd imagine. But with the support level holding on the daily chart I've decided to go long again. It appears like the USD may have gasped it's last breathe
Guys EURUSD has put in a double bottom at a big support level o the daily. Hourly chart shows some signs of a rally. Be careful with this one. The reversal zone is wide. This is a good spot for the 26.18 trade and it hasn't quite completed yet.
Opportunity to jump on a long NZDUSD position. Very nice risk/reward here. There is a bit of structure but not a lot.
Looking at the daily chart here we see a couple of bullish patterns setting up. Lots of time to watch this and even to look for good entries on lower timeframes if that's what you want to do.
NZD has been really strong lately but it's starting to show signs of fatigue. The assenting channel near structure gives me the indication we will likely see a break down. Not to say a news event won't blow things up but the chart reads weak.
AUDUSD just put in a nice head an shoulders pattern. How would you trade this? Short now? Wait for a break of the neckline? Look for a retest of the right shoulder? Tell me your thoughts.
I just talked about this Bat pattern in todays FMP video. If you front run your orders ahead of the .886 like I teach then you should have been filled.
EURUSD just filled the gap. Not much more to say. This is a shorting opportunity
For those of you who follow me in the Syndicate each morning, you'll recognize that we made money playing this double bottom on Friday. Well now the market has set up a nice 26.18 trade. Should be a buy at the open.
With the pound on a rampage the question is, Will anyone stick their neck out for a short? Well I'm going to be watching this pair very closely over the next week. We've run into a major support/resistance level on the monthly chart. The lower timeframes are still not giving me the signal I need to go short but everyone should be watching this level.


