Never_Enough_FX
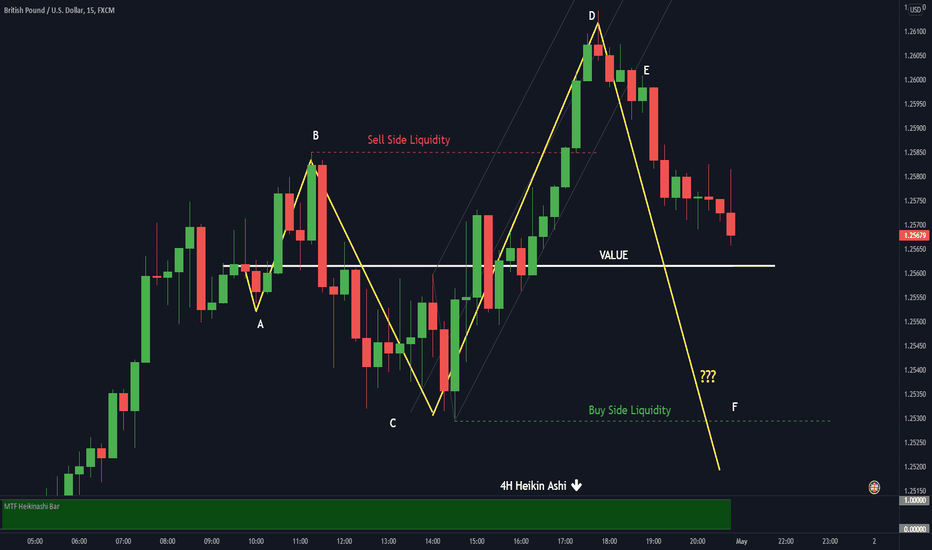
A,B,C,D,E - Classic funneling out master pattern price action, getting wider at each swing - grabbing buy/sell side liquidity and reversing onto the next liquidity spot. This is a textbook example of a multi-leg expansion. Refer to the linked idea "How Time Affects The Master Pattern"
Today was a day full of high impact news releases so it would have been wise taking a day off of trading. The reason I am posting this is to show how price still develops this pattern of behavior even when we get high volatility with the economic calendar news releases. Look how this framework still allows us to make sense of the market even in a day of supposed...
Depending of how you were managing the last trade, you would have been stopped at breakeven or some small profit. The spot X would be a nice short location IF the heikin ashi on the 4H rotates to red, for more aggressive traders, at least the 1H heikin ashi has to rotate so you can sell above value.
Continuing from where we left off yesterday EOD, price broke out the downward pitchfork during overnight end started a pullback which ended a while ago right at the value lines, where you could have entered a short. The 4H heikin ashi was still green but the 1H had rotated to red.
Beautiful development of the Forex Master Pattern today, in a macro and micro view. 1, 2, 3, 4 - Classic master pattern funneling out action from macro origin point A, B, C , D - Classic master pattern funneling out action from micro origin point Note that D is the Phase 3 (Trend) of the latest origin point, which is also leg 5 of the macro origin point which...
Continuing our analysis from friday: A, B, C, - Classic Forex Master Pattern funnelling out action as detailed previously D - Price failed to expand low, grab buy side liquidity and take out the C low, an indication price might reverse to take out C high E - 4H heikin ashi rotated to red and price entered a supply zone above value, this was a nice spot for a...
In a nutshell, this is the basic strategy. First you get the directional bias from your HTF and check which cycle of the master pattern it currently is, this will enhance the success probabilities. In this example, the HTF was trending down. When the HTF got below value, then we would have checked our LTF looking for an entry opportunity when it got above...
As time flows away from the contraction point, the market becomes more and more volatile.
Here we see why the Forex Master Pattern is a reliable concept that gives us solid trading insights.
A more in depth explanation of the contraction phase.
Here you can see on a real chart how to draw the lines objectively and mechanically the correct way. I developed an indicator for metatrader which does all that for me automatically, but you don´ t need the indicator if you are trading above 5min timeframe (more free time to draw lines). This example here is a nice one as you can see that when price went above...
To draw the lines is very simple. For the LTF you use a zigzag configured with: Depth:3 Backstep:1 Deviation:1 For the HTF: Depth:2 Backstep:1 Deviation:1 You use the zigzag swings to determine highs and lows. The trigger for the line is a simultaneous higher low and lower high, then you start drawing a line from the center of this range. Initially it is...
In the next tutorial I will teach you how to draw the lines in the correct manner. It is very objective and mechanical to do so, no subjectivity here.
The Forex Master Pattern is an alternative form of technical analysis that provides a framework which helps you to find and follow the hidden price pattern that reveals the true intentions of financial markets. This mater pattern is comprised by 3 phases which complete 1 market cycle. The Phase 1 is the contraction point (or Value). It is defined as simultaneous...
A, B, C, D - Classic funneling out master pattern price action, detailed in previous post. D , E - Would have been textbook sell entries if the 4H Heikin Ashi had rotated to red (or at least the 1H for more aggressive traders) F - Expected expand low target (buy side liquidity). If price reaches here we MIGHT resume the downtrend. Price usually reverses when...
The basic strategy of Forex Master Pattern is trading with your higher timeframe direction. In this method we want a good separation between LTF and HTF so in this example we have the 4H as the directional bias and 5min as the entry timeframe. You can see that when 5min was below value in relation to the most recent origin point (the Phase 1 of the master patter -...


