ONE1iMPACT
Premium📊 THE TRADING PLAYBOOK 🛡️ CONSERVATIVE SUPPORT PLAY Setup: Buy at Fibonacci support levels🚨 Entry: $158-$165 (0.618-0.5 zone) 🌟 Stop: $140 (Below all major support) ❌ Target: Tp1 : $200(25% gain) 💰 Tp2 : $232 (40% gain) 💰 ⚡ Position Size: 3-5% of portfolio ⚡ Time Horizon: 3-6 weeks 🎯 ______ NOTE _______ DYOR ⚠️ Not financial advice. This analysis is for...
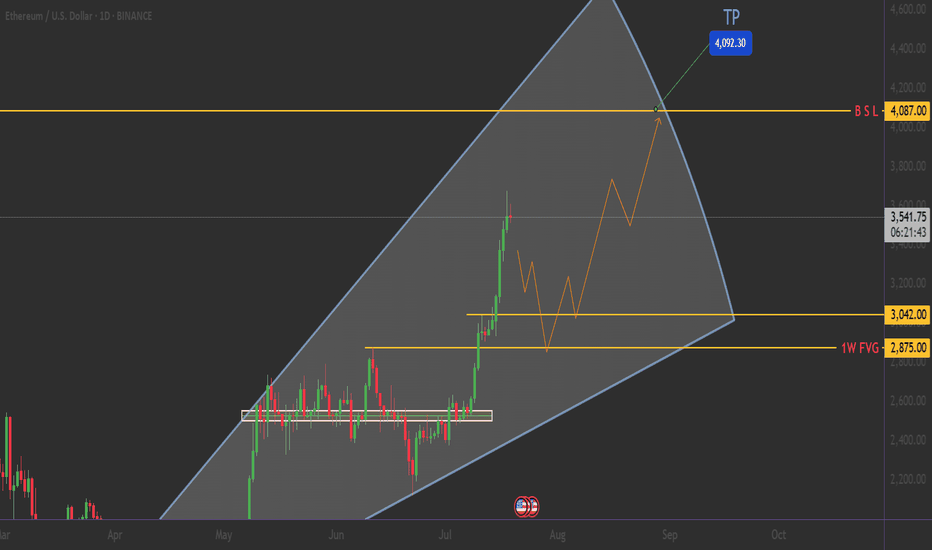
🎯 THE MEGA SETUP: Giant Symmetrical Triangle 🔍 What We're Looking At: 📐 Triangle Specifications: 🟢 $3,042.00 - Triangle Lower Trendline 🟢 $2,875.00 - 1W FVG (Fair Value Gap) 🔴 $4,087.00 - BSL (Buy Side Liquidity) 🔴 $4,200.00 - Psychological barrier _______________________ 🛡️ CONSERVATIVE LONG: Entry: $2,800 - $2,850 (Triangle support bounce) 📊 Stop Loss:...
⚠️ CRITICAL SUPPORT LEVELS 🛡️ Support 1: $115,000 (-3%) - Triangle support 🛡️ Support 2: $110,000 (-7%) - Channel support 🔴 DANGER ZONE: $105,000 (-11%) - Multiple pattern failure So... Strategy: Quick profits on pattern completion 🎨 Entry: $115k (Triangle breakout confirmation) 📊 Stop Loss: $114k below (Tight risk management) ❌ Target: $125k (+10%)...
THE GOLDEN SETUP: Triple Bottom Masterpiece : 🟢 BULLISH BREAKOUT SETUP 🎯 BUY ZONE: $3,324 (Neckline Break) 🚀 TP1: $3,377 🚀 TP2: $3,393 🚀 LAST TP : $3,408 Stop Loss: $3,312 (Below recent low) 🚨 🌟 Before You Trade: ✅Wait for neckline break ($3,325+)🔥 ✅Confirm with volume surge ✅Set stop loss below pattern ($3,312) ✅Calculate position size (max 2% risk)...
⚠️ RISK LEVELS (Know Your Exits) 🛡️ Support 1: $0.35 - Triangle support 🔴 ABORT: $0.25 - Major structure break ⚠️ MAX RISK: Never more than 5% of portfolio ⏰ TIMING IS EVERYTHING: THE COUNTDOWN BEGINS PRICE TARGETS THAT WILL CHANGE LIVES 🚀 CONSERVATIVE TARGETS (High Probability) 🎯 Target 1: $0.80 (+95%) - First major resistance 🎯 Target 2: $1.20 (+192%) -...
📊 CURRENT SNAPSHOT 🔍 KEY TECHNICAL LEVELS 🟡 CRITICAL RESISTANCE ZONES Major Resistance: $0.800 - Key breakout level Secondary Resistance: $0.900 - Previous support turned resistance Target Zone: $0.585-$0.536 - Golden pocket area 🔵 CURRENT BATTLE ZONE Price: $0.664 - Testing key support Descending Wedge: Bullish pattern forming Volume: Declining - Typical before...
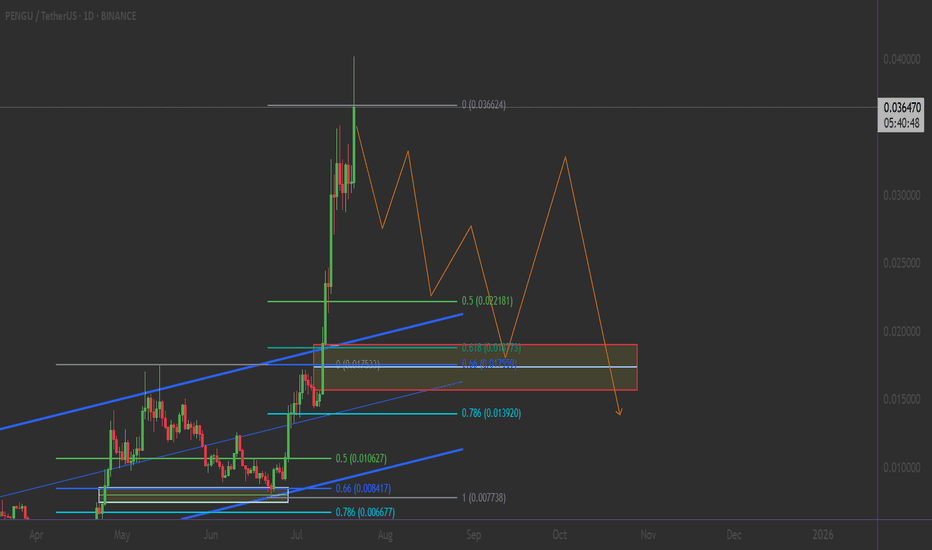
💎 THE GOLDEN SETUP: 5-Point Technical Confluence 1️⃣ FIBONACCI MASTERCLASS IN ACTION 0.5 Fib Level: $0.021181 (HELD PERFECTLY) ✅ 0.618 Golden Ratio: $0.017920 (Strong Support Zone) 0.786 Deep Retracement: $0.013920 (Ultimate Backstop) Current Position: Trading above 0.5 Fib = BULLISH CONTROL __________________ ❌ BEARISH Break below $0.029 (Channel...
📐 Perfect geometric pattern formation 📊 Volume profile supporting the setup 🎯 Clear target zones with minimal resistance ⚡ Compression leading to expansion 🎯 THE SETUP: Triple Confluence Strategy 🔥 📍 ENTRY ZONE: $1.00 - $1.06 🎯 TARGET 1: $2.000 (+85%) 🎯 TARGET 2: $2.400 (+120%) 🔴 STOP LOSS: $0.95 (-3%) ___________ NOTE ____________ 🚨 RISK MANAGEMENT 🚨 DYOR
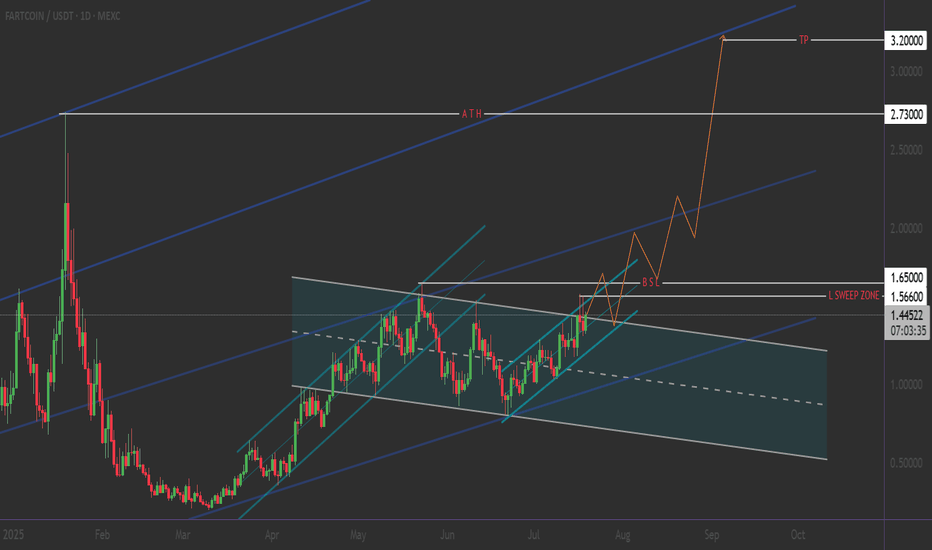
💡 CREATIVE TRADING STRATEGY: "The Triangle Rocket : 4-month ascending triangle = BREAKOUT TIME! ___________________ 🟢 BULLISH SCENARIO (High Probability) ENTRY ZONES📈 🛡️ Conservative: $1.30-$1.35 (Pullback to support) TARGETS: 🎯 Target 1: $1.85 (+28% from current) 🎯 Target 2: $2.30 (+60% from current) : L S S 🎯 Target 3: $2.73 (+88% from current) : ...
From a purely technical‐analysis standpoint (not financial advice), here are a few observations and ideas you can take into xrp/usdt 1. Descending Trendline Resistance - Price has been making lower highs, forming that yellow descending trendline. A sustained break and close above it (on higher‐than‐average volume) would be a strong bullish signal. - If...
Professional Technical Analysis & Trading Plan for BTC/USD (Hypothetical 2025 Data) --- 1. Technical Structure & Key Observations A. Price Context: - **Current Price:** ~84,197 (below SMA 81,998). - **SMA (Simple Moving Average):** 81,998 (likely 200-day SMA, acting as dynamic resistance). - **Volume:** 52K (low volume suggests consolidation; watch for...
📊 Key Stats (Live Update) - Current Price: $0.000022 - Volume: $1.33M (Accumulation phase) 📈 Critical Levels - Strong Support: $0.0000192 - Immediate Resistance: $0.000027 - Breakout Target: $0.00004 (+85% upside) 🔥 Why BONK Could Moon 1. Extreme Discount: 92% below ATH ($0.00003275) 2. Meme Coin Rally: WIF +12% today showing sector strength 3....
💨 FARTCOINUSDT: The Gas That Could Ignite! 📊 Current Market Snapshot - Price: $1.2446 (-2.85%) - Volume: $351.81K (Medium liquidity) - Key Levels: - Support: $1.22 - Resistance: $1.28 - Psychological Level:** $1.30 🎯 Trading Strategy - Long Setup: - Entry: $0.67 - $0.72 - Targets: $1.2 → $1.35 → $1.60 - Stop Loss: $0.64 - QUICK TRADE -...
🚀 THE MOON MISSION (Resistance Zone) HEALTY TARGET: $3,500 - Your text says it all! Upper Trendline: Acting as launch pad Psychological Resistance: $3,000 round number 🟢 CURRENT LAUNCH PAD Price: $2,529.15 - Breaking above key resistance Previous Resistance: $2,324.45 - Now turned support Support Zone: $2,277.81 - Strong foundation 🔴 DANGER ZONE (Abort...
🎯 KEY LEVELS DECODED 🛡️ FORTRESS SUPPORT: $102,800 - $103,200 _____________________________ NEUTRAL STRATEGY: Buy Zone: $102,800 - $102,600 Sell Zone: $110,000 - $112,000 Stop Loss: $100,500 (range breakdown) Target: Opposite end of range Position Size: 3-5% of portfolio _____________________________ 🎢 SCENARIO : (Probability: 35%) If BTC consolidates between...
🎯 The Trading Strategy : ⚠️ The Reality Check Let's be honest - this trade isn't without risks... Entry Strategy: The Golden Support Zone : 0.05-0.055 (ALL TIME LOW levels) ⚡Target 1: $0.11 ⚡Target 2: $0.13 ⚡Target 3: midlle of 1W FVG 🔥 Risk/Reward: 4:1 🔥 _________________ Risk Management: Stop Loss: 0.048 (Below major support) Trade smart, trade safe, and...
🧠 INSTITUTIONAL MINDSET At $3,365: "Perfect! Time to sell into retail buying" At $3,337: "Let's see how this plays out" At $3,318: "Preparing for the hunt" At $3,270: "Starting to accumulate" At $3,245: "Loading the truck! This is what we've been waiting for" 🔍 LIQUIDITY ZONES DECODED: The Hidden Treasure Map 🎯 BELLOW SELL IF CLOSE CONFIRMED:...
The Setup: "The Healthy Pullback Hypothesis 🔵 BLUE SUPPORT TRENDLINE (Rising from ~$76K) The Foundation: This ascending support has held multiple tests Current Status: Price dancing right on this crucial line Psychology: Bulls' last stand 🔴 RED RESISTANCE CHANNEL (Descending from $112K peak) The Ceiling: Two parallel resistance lines creating downward...


