Ob_Radi
Entry: previous price movement Has broken out of previous supply zone and tested confirming entry Point. I analyze my chart starting with the 4 hour chart placing my Support and resistance (Entry Chart), I then analyze my Day chart for a general trend analysis and also draw my support and resistance. I return to my 4 hour chart and look out for supply and...
Gold has been consolidating for a while now , it has finally broken out of the consolidation box It must go down Entry after retest Take profit support zone Stay blessed🙏🏾
The pair broke out of of consolidation and retested awaiting close of retest for entry Tp: next zone S/L: 10 pips above retest candle
The pair is currently retesting on the Neckline Wait for bullish candle to close first Bless
The pair has broken the neckline of the head and shoulders The pair has retested on the neckline now Entry: immediately after the neckline Stop loss: the shoulder of the head and shoulder Take Profit: support
As you can see on the chart the pair has been moving and respecting the upward channel for a while now Trading the channel you must follow a very simple rule enter when retests one side of the channel Take Profit when it touches the other side of the channel In this case entry on the supports after retest Exit the other side of the channel
The pair recently rejected a resistance zone which it has'nt been able to break since July 2019 The pair broke out of the uptrend parallel channel Double top chart pattern has also been identified , the candle broke the neckline The pair has confirmed it is going down Entry: Neckline of chart pattern Stop Loss : Previous Zone Take Profit : Next zone
Pair recently broke out of major resistance , it retested and confirmed break out Entry : after Bullish candle ,after retest Stop loss : below bearish candle that retested Take Profit : next major zone
EURGBP Recently broke Support and retested on current resistance on the 4 ho Entry : after close of retest on the 4hr time frame Stop loss : on the tail of the pin bar on the 4hr time frame Take Profit : Support of the day Time frame
Gbpusd has currently broke neckline of head and shoulders time frame Entry: break of neckline Stop Loss: shoulder Take Profit : Next zone
Gold has currently broke a major support which is the neckline of the head and shoulder chart pattern, Retest and confirmation has been made on hour time frame Take Profit: Next zone Entry : after retest on hour time frame Stop loss : shoulder of head and shoulder
Currently broke out of Ascending triangle chart pattern Entry: candle after breakout Stop loss: other side of triangle Take Profit : the bottom zone of the triangle
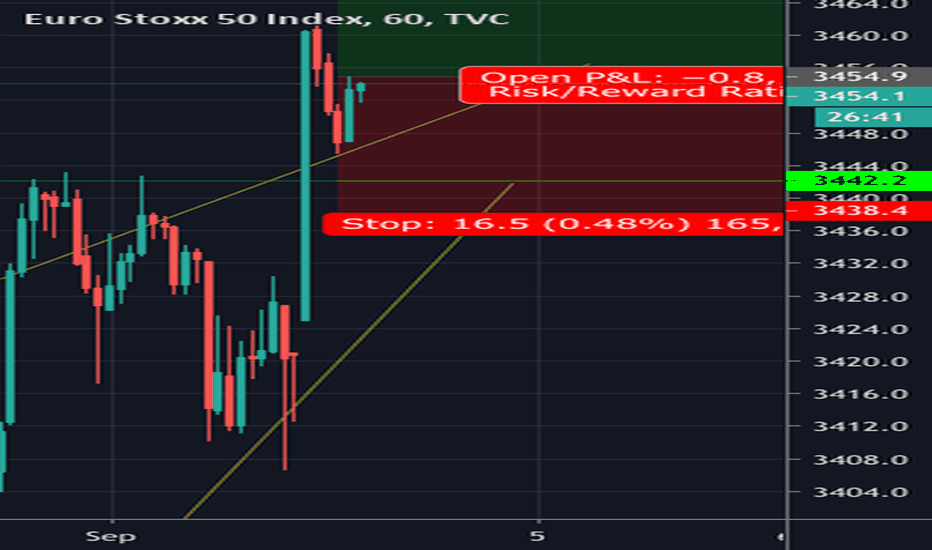
Hey good people weekly analysis on the stoxx50 Currently broke out of the ascending triangle awaiting entry after retest Stop loss: below candle that retested Take Profit : next zone
Pair to look out : Key to btc success in my opinion is waiting for the descending triangle chart pattern to form and waiting for confirmation before entry Entry after retest from the Descending triangle support Stop loss just below the Descending triangle Take Profit next zone
Hello there Channel Set up The USDJPY currently retested on the resistance of the downward channel First Take profit :50fib level Entry :after retest of resistance level of channel
Hey beautiful people Today’s set up ready for entry on the 4 hour time, : reached the support of the weekly channel and retested for entry, retested on support of a major zone (another entry point) Exit: next major zone Here I use multiple time frames in order to reach to this conclusion support and resistance are your best friend Thanks for giving your...
On the 4 hour time frame it recently just touched the resistance and the zone after was rejected awaiting retest for entry
The pair just broke out the weekly head and shoulders neckline


