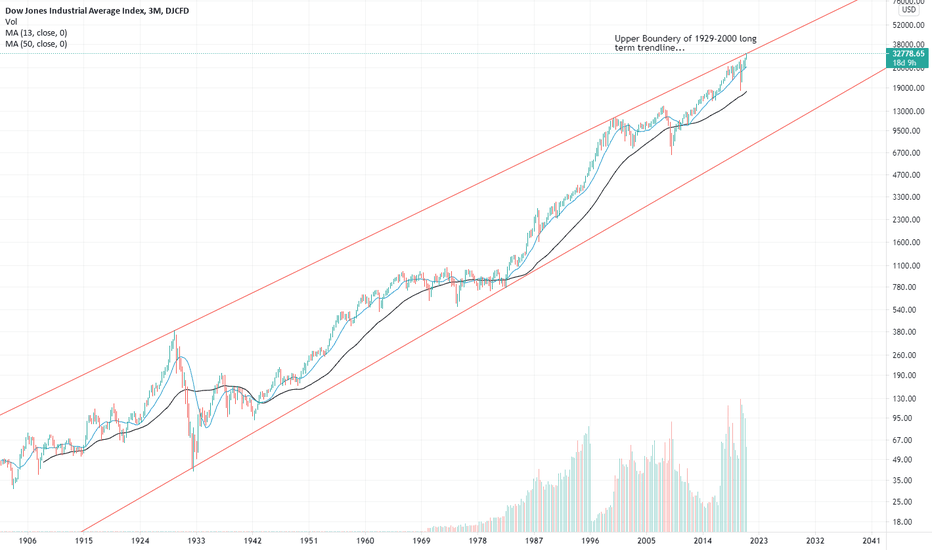
Last March I posted on this particular topic already and it is just becoming more exciting! The red line is the trendline that goes from the top in 1929 to the dotcom top in 2000. Note that this is a logarithmic chart. Point is that we are again testing this trendline. Although the week is not over, it seems that~the market does not want to buy above this...
Galapagos springt uit zijn meer dan een jaar oude dalende wig. Volume vandaag geeft aan dat kopers de overhand gaan krijgen. Bevestiging zou moeten komen van nog een stevige candlestick en mogelijk openingskoers met een gap tot boven de MA50! Galapagos broke out of its one year(+) old falling wegde.. I believe a first sign of a powerfull recovery. Some ting to...
I believe worth to share.. Just glanced at the DAX 3 month chart.. I saw that the German DAX30 index touches long term resistance that potentially could cause a rejection in the next days followed by a correction ... Today it opened with a gap up, and given de duration of the rally that started March 8th, I think it is time to cool down. Then I think is good to...
Just remarkable and noteworthy to look at.. The DJ industrial index just arrived at a critical zone of potential resistance on a ulta long term timeframe. This is the line between betwwen the 1929 top and the 2000 top . Indeed: The two school examples of big stock market crashes. I was wondering where the rally of the DJ industrial index came form. Just had a...
For some days I tried to figure out what the Nasdaq 100 was doing.. I looked at the monthly, weekly and daily charts and see the outcome. I believe the uncertainty of the last days as strongly related to a strong resistance (red) that is caused by the upper boundary of a multi-year trend channel. This seems to have caused selling pressure in the last two weeks....
Note that today the NASDAQ escaped (against the usual expectation) the wedge shaped triangle it had been in since the recovery from the "Covid19-dip". Normally in such a shaped triangle, and when it is pointed upwards, chances are high that the price will drop blow the wedge. However the NASDAQ does not. Certainly against all odds and the logical expectation given...
Critical days for the Microsoft stock. there are various signs that we we are nearing the end or the "post-corona" dip recovery, and with Microsoft being a critical part of it, its says a lot of the status of the Nasdaq 100. In this market everything is possible, so even a continuation of the bullish movement of the past months. Specific to Microsoft, I would say...
Then, you would go out ASAP I presume.. In fact, it is not an hourly chart but the monthly chart of the German DAX index. When you look at the chart form a monthly perspective you see how devistating the damage of the March Corona sell-off actually is. It could very well be that just this week the bulls gave a last show for now.. Some observations: Most...


