In this DOGE/USD trading analysis, we examine the market movements since 2021, highlighting the rapid rise in price that surpassed the previous all-time high (ATH) and extended into the TP (take profit) zone. Identifying major structural zones on the line chart, a common pattern emerges, signaling another potential bull run for this cycle. Support has been...
In this GOLD/USD trading analysis, we delve into the market movements since 2020, focusing on the formation of a harmonics pattern and the confirmation of the previous low-loading region as support. Notably, the market surpassed resistance around $1500, signaling a significant bullish momentum. Further analysis of the daily timeframe reveals a trend of treating...
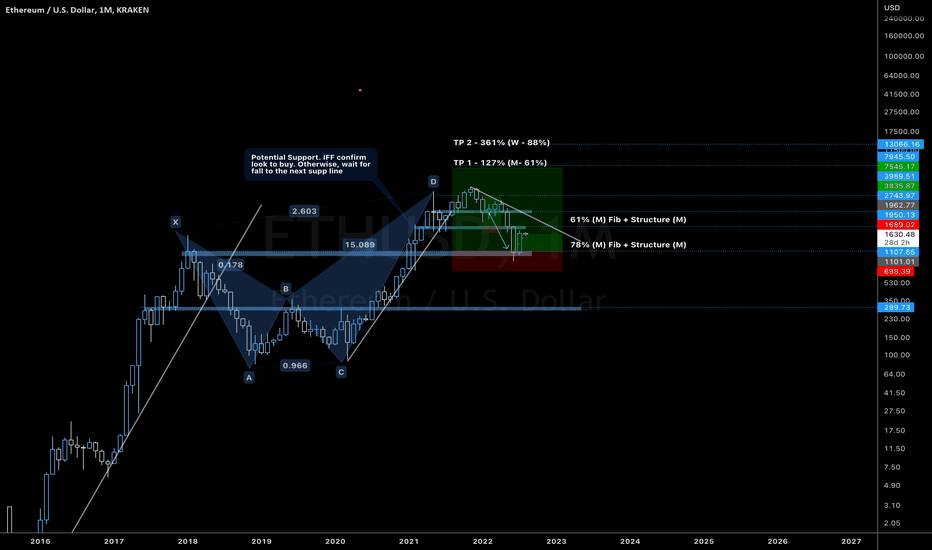
In this ETH/USD trading analysis, we explore the market movements since July 2022, highlighting the formation of a harmonics pattern and the confirmation of the previous low loading region as support. Notably, the market breached resistance around the $2000 mark, indicating a significant bullish momentum. Further analysis at the daily timeframe reveals a trend of...
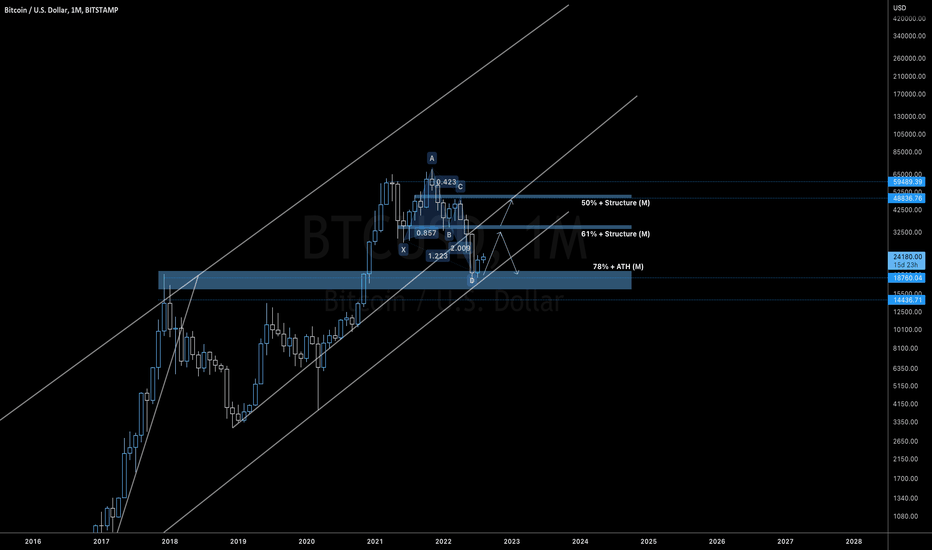
Title: BTC/USD Trading Analysis: Harmonics Pattern and Loading Zones Explained Summary: In this BTC/USD trading analysis, we delve into the intricacies of the market dynamics since August 2022. Observing the formation of a harmonics pattern, we witnessed the testing and confirmation of the previous low loading region as support. However, recent developments have...
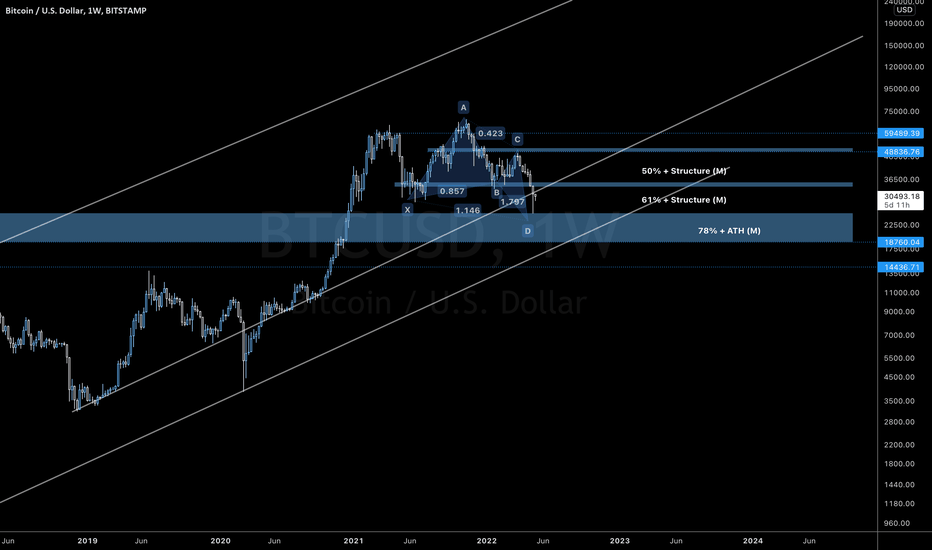
Hello Traders, This is more of a review of my previous setup and education. If I were to trade, I would await another push towards the 78% monthly Fib structure. That zone seems to be the biggest loading zone before a tumble to $10k.... The probability is lower but not insignificant. Be patient traders. Wait for confirmation and USE PROPER RISK!!! Good luck
Hey gang, After reviewing this chart we notice that the 78% fib did infant become a significant level of support. This acted as the structure allowing the price to bounce up towards the 61% fib/structural zone. I personally am waiting for either breakout above the 61% fib with confirmation (less probably), or the retouch of the 78% fib level. I am NOT trading...
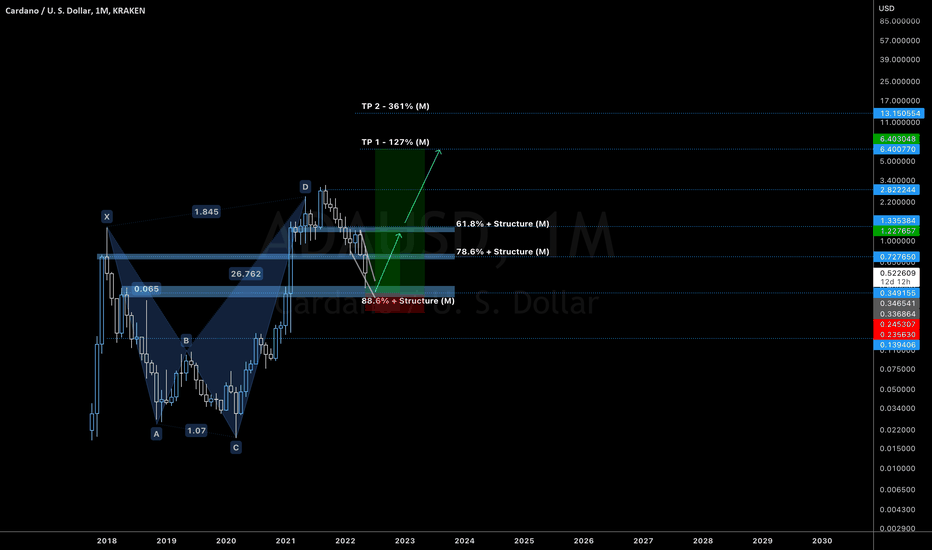
After hitting TP 1 last May when I did this coin over a year ago, we finally started our transition towards a bear market which is normal, expected, and healthy. Currently, we are approaching $0.04 with a high probability of transitioning and turning the zone of structure into support. I am waiting to get confirmation prior to entering using a martingale system....
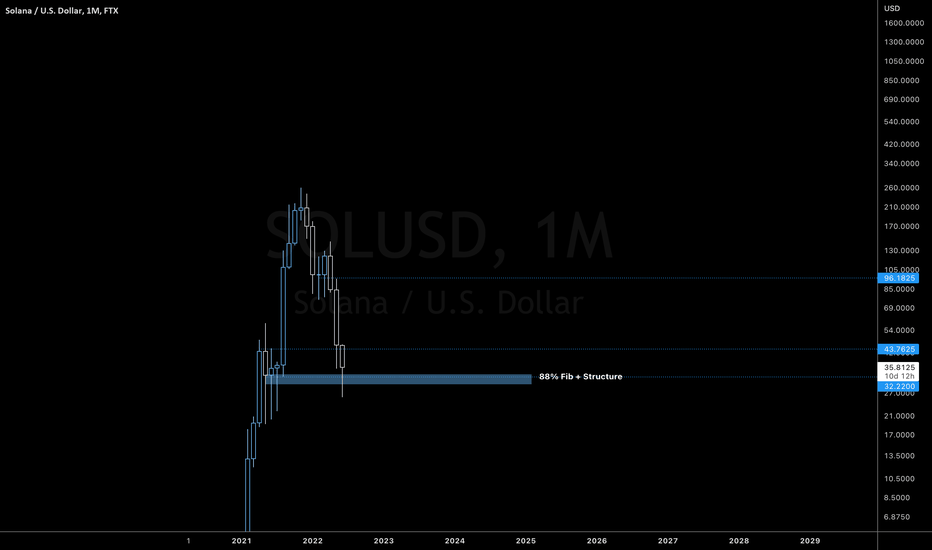
We are touching important support at the moment. In addition to being in a monthly and weekly structure, we are also in line with our 100% fib / 88% fib of the respected x-a legs (see video). IF and ONLY if we close and confirm structure (already started weekly and daily) will this be a safer buy. As of now the probability of a reversal is greater than the fall....
I am pleased to see the monthly candle close confirm (or pseudo confirm) many of my latest entry options. Once more I am still dollar-cost averaging but using these opportune moments to buy in at much more lucrative prices. We had (post hoc) multiple signals for a crash including broken trend on monthly/Weekly and an ABCD pattern plain as day. Now we are...
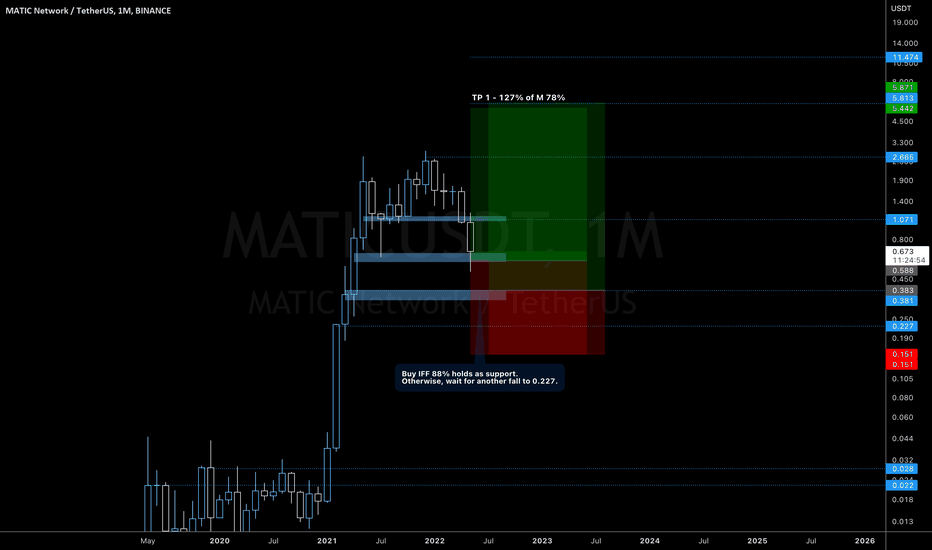
Hey everyone after the long-awaited moment, we finally have a good entry with a possible continuation to the downside. This only means greater buying opportunities, brothas (and trading sistas) !!! Check out the video to see how price is respecting current fib levels in addition to the possibility of falling to 0.22 before jumping up to our current resistant...
READY TO BUY SZN!!!! We are testing a nice level of structure however we still have weekly bearish momentum. Be diligent and start looking for confirmations or else price could possibly fall towards the ~$0.50 level God luck traders
Trading is about patience. trading is more about wealth preservation than a generation. I can say that my moment has officially arrived. Despite no apparent confirmation in the charts atm I am about to start heavily investing back into ADA, as of today. I use a dollar-cost average approach, so please use proper risk and consult your FA- this is not FA. We saw a...
Hey everyone, we are finally hitting respectable levels that excite me enough to start looking for a more significant entry. currently, we are at the confirmation cycle of a head and shoulder pattern however the final shoulder is respecting the current major monthly structure and the 61%. However, considering the sentiment and overall market we could still see...
Hi everyone, Sorry for the hiatus. I am thankful to share this idea with you as it took a year to manifest. As a swing/positional trader, I try to look at higher timeframes and never force a trade. I can say that after a year I am finally ready to join the crypto market again as a consumer and buyer-- specifically in regard to BTC. I mentioned last year that...
For my English speakers: I am saying that the price broke major support which happened to align with the 38% fib. With broken support on the higher time frames and structure-forming, suggesting resistance on the lower timeframes make the possibility of a continued fall imminent. I am waiting for further confirmation n the daily with proper 4H context for...
Vou explicar em ingles: if price respects support at the 38% level which aligns with support in addition to completing the harmonic pattern on the lower timeframes, then and only then, do we have a possible bullish opportunity? Price is already trading below the previous annual candle close low. If the price continues to break and trade below, creating...
Potential head and shoulder showing potential bearish sentiment.
As we scrapped profit heading past our previous ATH, eth experienced a dramatic pullback where we see price testing new significant levels of structure. Currently, we are trading above, potentially treating it as support. However, soul we a break and fall with a potential head and shoulders forming leaving room for heavy negative momentum if the bears catch hold...


