I’m #2505 in The Leap! It’s the paper trading competition by TradingView and Pepperstone with real money prizes. My current profit: +24.66% (+$61,659.06) — better than 93% of participants.
The chart for APL Apollo Tubes shows a significant price movement over the past few years, with a notable peak around mid-2024 followed by a downward trend as of April 18, 2025. The stock reached a high of approximately INR 1,800 before declining to its current level near INR 1,594. Investor Holdings Franklin Templeton: Increased holdings from 1.2% (2024-12)...
Disclaimer: This is not financial advice. Please do your own research or consult with a financial advisor before making any investment decisions. Investments in stocks can be risky and may result in loss of capital.
Disclaimer: This is not financial advice. Please do your own research or consult with a financial advisor before making any investment decisions. Investments in stocks can be risky and may result in loss of capital.
Disclaimer: This is not financial advice. Please do your own research or consult with a financial advisor before making any investment decisions. Investments in stocks can be risky and may result in loss of capital.
Disclaimer: This is not financial advice. Please do your own research or consult with a financial advisor before making any investment decisions. Investments in stocks can be risky and may result in loss of capital.
Disclaimer: This is not financial advice. Please do your own research or consult with a financial advisor before making any investment decisions. Investments in stocks can be risky and may result in loss of capital.
Disclaimer: This is not financial advice. Please do your own research or consult with a financial advisor before making any investment decisions. Investments in stocks can be risky and may result in loss of capital.
Disclaimer: This is not financial advice. Please do your own research or consult with a financial advisor before making any investment decisions. Investments in stocks can be risky and may result in loss of capital.
SBICARD is currently at a crucial technical juncture. After a long consolidation and multiple rejections from a descending trendline (marked in grey), the stock is now attempting a decisive breakout on the weekly chart. 📊 Key Observations: Price has broken above a multi-year trendline resistance. Strong bullish candle. Breakout level around ₹860–₹870 —...
Disclaimer: This is not financial advice. Please do your own research or consult with a financial advisor before making any investment decisions. Investments in stocks can be risky and may result in loss of capital.
Disclaimer: This is not financial advice. Please do your own research or consult with a financial advisor before making any investment decisions. Investments in stocks can be risky and may result in loss of capital.
The Nifty 50 index has formed a potential inverse head and shoulders pattern on the daily timeframe, which generally indicates a bullish reversal. However, there are key levels to watch before confirming the next move. Key Observations: Support Levels: The 50% Fibonacci retracement level at 22,937 is a crucial support. The 61.8% Fibonacci retracement level at...
If the stop-loss hits, no worries, we just have to follow the plan and try again. Disclaimer: This is not financial advice. Please do your own research or consult with a financial advisor before making any investment decisions. Investments in stocks can be risky and may result in loss of capital.
Disclaimer: This is not financial advice. Please do your own research or consult with a financial advisor before making any investment decisions. Investments in stocks can be risky and may result in loss of capital.
Ignore the news and focus on the chart. If the stop-loss hits, no worries, we just have to follow the plan and try again. Disclaimer: This is not financial advice. Please do your own research or consult with a financial advisor before making any investment decisions. Investments in stocks can be risky and may result in loss of capital.
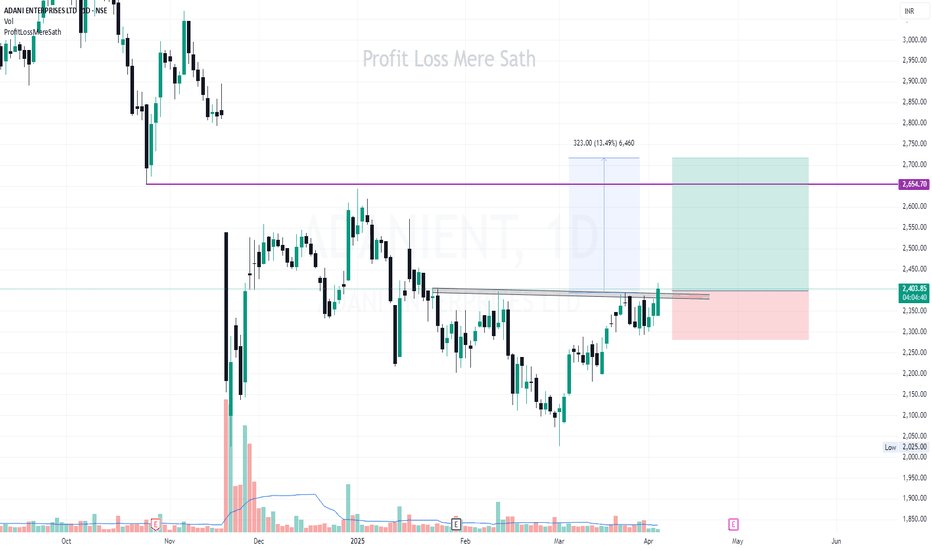
The stock has been consolidating below a resistance level for several weeks. Today, it has given a breakout above the trendline resistance with good volume. This breakout could trigger a potential uptrend. 🔹 Target & Resistance: Target: ₹2,654.70 (+13.49%) Resistance Level: ₹2,654.70 (marked in purple) 🔹 Volume Confirmation: The breakout is supported by...
Disclaimer: This is not financial advice. Please do your own research or consult with a financial advisor before making any investment decisions. Investments in stocks can be risky and may result in loss of capital.


