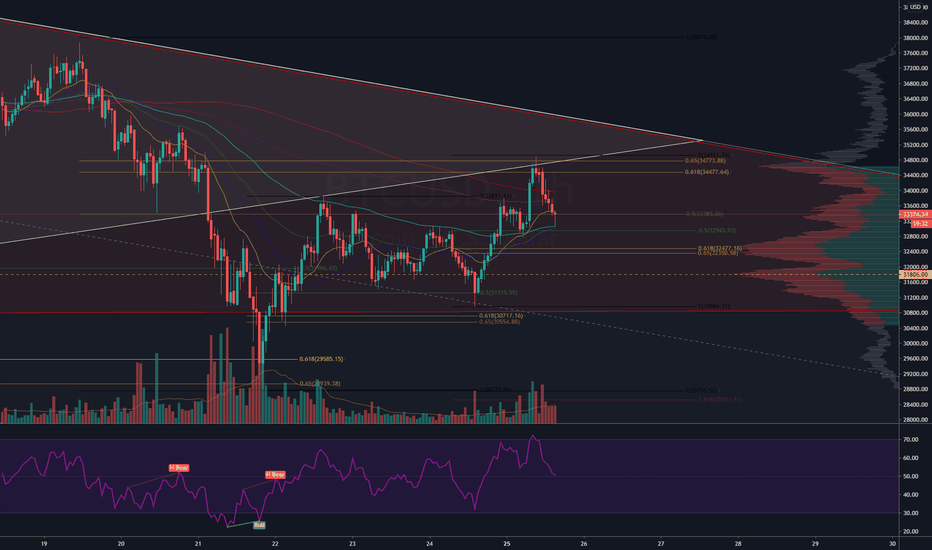
BTC price has found support around 31K, but the bounce has been weaker each time from this last line of support, creating a descending triangle. Are we going to test lower support or maybe there will be a fake out first? Would love to hear what you think!
BTC price action is forming a inverse head and shoulders. The volume is not great yet in my opinion. Waiting for volume to start coming to confirm a break out or fake-out. Thinking of potentially make a breakout play here with a tight stop loss . Do you guys think it will break out? or is this a fake out?
As we approach the monthly close, I am noticing a pattern similar to the 2017 bull run. What you think about this? is this an indication or a coincidence?
After massive bullish exuberance, it seems like two daily candles are going be closing inside the downtrend channel. The price is at an interesting spot, between 21 Daily EMA and 21 Daily MA. I think a break below the 21 Daily EMA could lead to a larger downwards action in price.
Bitcoin had a large move to the upside with convincing volume in the morning. However, it was also a move that was part of Elon Musk twitter and the Reddit news, etc. We were looking at a bear local trend and a potential downside supports before the overnight move up. If the Daily candle closes under the 21 EMA and well within the descending channel, I think...
We were looking for a the bearish sentiment to play out, and gather bullish support from the $24K ranges. Due the current socio economic movement, large celebrities like Elon Musk support crypto currency and largely de-centralized finance, the bulls had enough strength here to break the down trend and push it up. This is really good news for crypto currency as...
It seems BTC price is playing out the descending triangle, so far. creating a new local higher high would invalidate the the Bearish theory, a price close above $35K. Next major support is found between $24K to $19K; coinciding with the CME gap fill, highest price action volume, daily RSI cool off, between the 100 and 200 Daily EMA, golden support range of 0.618...
BTC is looking weak here, speculating a SHORT play around $33,550. Break of the down channel, creating a higher high with volume as my invalidation (SL: $35,500).
We are getting the rejection now and the volume is starting to come to the bearish side. Price has already moved down around 5% from our resistance level. If you are feeling bearish here, you can speculate entering shorts as price moves back up with a stop-loss at slightly above 35K. 35K because that would invalidate the bearish scenario by creating a higher high....
BTC price has slowly moved up to our marked resistance range. The volume hasn't been convincing during the move up thus far. Do you think the descending triangle will play to the downside and potentially filling the CME gap (around 25k)?
BTC is approaching a confluence of resistances. If it can not break the down trend channel with good bullish volume, I am expecting a bounce down for the short term.
Would you short BTC at 35K? BTC is looking weaker based on volume and price action to me. I think we can expect a bounce up, but if the volume is not there, then I m expecting a reversal. What do you think?
I am currently sitting in a short. Something to keep in mind is the CME gap as well.
Just wanted to put this update as a level/channel to watch on the rise up. Is this a fake out rally or a ascending triangle (Bullish) in the making? The bullish volume seems relatively low at this moment.
Today's BTC daily close is at a critical resistance point. Will BTC price break the down trend and retest the highs? The volume seems it indicate that there is more bearish pressure than bullish pressure. That being said, there may be a liquidity grab to push the price to lower 11K-11.5k ranges before a drop down to test previous support in the $9K ranges....
The price of bitcoin has found support at the 0.618 fib and is currently trading in the bottom range of an ascending channel. at the lower time frames, it almost seems like we are forming ascending triangle (bullish). One could argue that the price is forming a bear flag (fall, slow climb up , and fall again). There are alot of EMA resistance just above the...
The price of bitcoin has been trading very technically! The price went up to test 11.2K and was rejected by the resistance ( golden ratio, rising channel resistance ). Now the price has fallen to previous support / bottom of the channel at the next 0.618 golden ratio. The price move down did not subject to massive volumes - This could mean that the bulls are not...
After the drop in price, BTC looks like it is picking up some support here. Looking to to see if BTC can break the down channel and bounce up to test local POC (resistance) around lower 11K ranges. If the volume on the retest decisively breaks the resistance, I will stay a bull. if the volume on the retest seem week, I'd close my long there.


