TradingShot
PremiumPattern: Channel Down on 4H. Signal: Bullish as the price is approaching the former Higher Low line and the 1D MA200, both of which can provide Support. Target: 2.2000.
Pattern: Channel Up on 1D. Signal: Bearish as the price was rejected near the 1W Resistance. Target: 0.6525 (above the Symmetrical Support).
First of all allow me to start off with wishing everyone a Happy New Year and a prosperous and profitable 2020 ahead! Now, Bitcoin is just picking up right where we last left it. Consolidation, nothing more nothing less (see my previous BTC study on this accumulation at the end of this text). There certain criteria that will favor the Bull Case and other that...
Before starting my analysis I want to wish everyone Merry Christmas ! Now, I have made this chart in an attempt to put all correlating factors of Bitcoin's previous and current cycle into perspective. The parameters that I am focusing on are the MA150/200, the Cycles' High Volatility Zone, the 2nd and 3rd Halvings and the LMACD. *MA150/200 Buy Zone* I don't...
Just a quick reminder on the position Bitcoin is at on its long term cycle. As the title says there are just too many bullish indicators at this stage to ignore if you are a long term BTC investors. That doesn't mean that the price "can't" drop lower e.g. 5 - 5.5k but after the June decline and given Bitcoin's long term trend, we won't have too many opportunities...
CROBTC may be ahead of s strong multi month bullish break out according to a certain set of indicators. 1. The MA50 on 1D has turned flat since late September, an possible indication that the price has found support on the long term. 2. The 1D RSI broke above the 70.000 Resistance level for the first time. That level has previously rejected the price twice. 3....
Pattern: 1D Rectangle. Signal: Bullish as the price rebounded on the Support and the LMACD is close to a bullish cross. Target: 0.00000094 (Resistance 1) and 0.00000104 (just below the Resistance 2).
Pattern: Fractal repetition. Signal: Bullish as long as the price remains above the symmetrical support (bold black line) Target: 0.00005000 (just below the Symmetrical Resistance).
Pattern: 1D Channel Up. Signal: Bullish on the next Higher Low (typically the 1D MA50 supports and the RSI goes within 50.000 - 45.000). Target: 14.1500 (projected Higher High of the pattern).
I rarely look at short term set-ups but I cannot overlook this pattern. The recent rebound on the 1D Support Zone (6,515 - 6,420) has so far found Resistance and rejected on the 4H MA200 (orange line). That made a new Lower High on a pattern that appears to be a Descending Triangle. Typically I expect a continuation of the downward sequence towards the 1D...
Pattern: Rising Wedge. Signal: Bearish if the Higher Low trend line breaks. Target: 3,170 (potential contact with the 1H MA50) and 3,135 (potential contact with the 1H MA200).
Pattern: 1H Channel Up. Signal: Bearish as the price failed to break the medium term Higher High trend line (bold black) was rejected sideways and formed a Death Cross (MA50 crossing below the MA200) while the 1H RSI is trading on a bearish divergence. Target: 28,030 (1H Support) and 27,800 (4H Support).
Pattern: Rectangle on 1D. Signal: Bearish if the Higher Low trend-line (red shade) breaks. Target: 0.8900 (symmetrical Support).
Even though I've done various comparisons of Bitcoin to other traditional assets like indices, commodities and stocks (see the bottom of this study for ideas), the current one is more out of curiosity to see what the public sentiment is like (especially now that BTC is on decline) among cryptocurrency traders when it comes to Bubbles. As you see on the main chart...
Pattern: 1H Head and Shoulders. Signal: Bearish as the price is testing the neckline's Resistance with pressure from the 1H MA50. Target: 1.11055 (potential contact with the MA200) and 1.10750 (1H Support).
Pattern: Rectangle on 1D. Signal: Bullish as a potential Golden Cross may initiate a parabolic rise similar to the February-March sequence. Target: 0.00003700 (just below the Symmetrical Resistance).
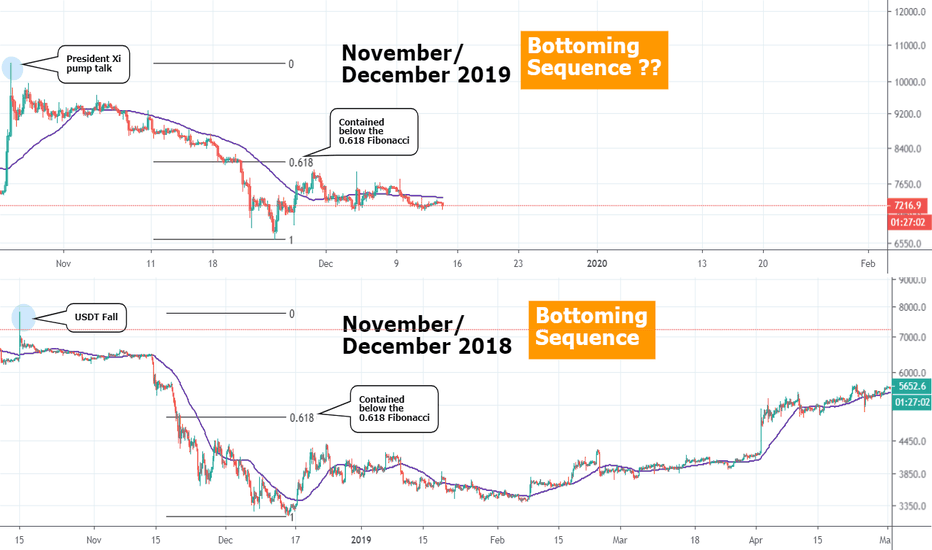
Undeniably both fractals look similar. The November - December 2018 sequence with the November - December 2019 sequence. The first provided the bottom of the latest Bear Cycle. Can the current one provide the bottom of the June correction? This is what I will address on this study. Let's start off with the similarities of the two sequences: *It all starts...
Pattern: Parabolic rise on 1D. Signal: Bearish as it is approaching a Symmetrical Resistance level (rejected the price 8 times since 2016) with the RSI on 3 year highs. Target: 137.000 (Symmetrical Support). *Such long term symmetries are useful and quite accurate. I have successfully implemented this approach on my last GBPJPY buy signal:


