Back when BHEL was trading near 275 (March 2024), I raised my eyebrows and published an idea called Trader’s Trap. While I might have been a bit fast-forward (6 months ahead), my concern about the stock in March 2024 finally started unfolding in September 2024, after it topped at 335 highs. From March 2024, the way BHEL was moving was not convincing—and you...
For Educational Purpose Last Price- 3480 / 20:29 Hrs IST (Indian Standard Time) / 19th Oct2020 Wave (iv)- Penultimate wave -unfolding as a triangle then next wave should be the final thrust upside - only criteria is top @3588 should not be crossed for current wave count to be a valid count Expecting One push upside close to 3550/3570 to finish wave-(v) (...
SP500 / US500 has been all messy & choppy -if upside rally stops in 3450-3475 then we expect down move with initial halt close to 3300 level & dropping further can take it to 2935-2950 ------------------------------------------------------------------------------------------------------------------------- NASDAQ 100 - Head & Shoulder at the top-12440 High...
Disclaimer ----------------------------- All investments involve risk, and the past performance of a security, industry, sector, market, financial product, trading strategy, or individual’s trading does not guarantee future results or returns. Investors are fully responsible for any investment decisions they make. Such decisions should be based solely on an...
Disclaimer ----------------------------- All investments involve risk, and the past performance of a security, industry, sector, market, financial product, trading strategy, or individual’s trading does not guarantee future results or returns. Investors are fully responsible for any investment decisions they make. Such decisions should be based solely on an...
Disclaimer ----------------------------- All investments involve risk, and the past performance of a security, industry, sector, market, financial product, trading strategy, or individual’s trading does not guarantee future results or returns. Investors are fully responsible for any investment decisions they make. Such decisions should be based solely on an...
Disclaimer ----------------------------- All investments involve risk, and the past performance of a security, industry, sector, market, financial product, trading strategy, or individual’s trading does not guarantee future results or returns. Investors are fully responsible for any investment decisions they make. Such decisions should be based solely on an...
Scaenario 1 - DowJones Falls 1000 points more below 25760 to another key level at 24680 - breaking that support it could be some serious fall of 3000 points more to 21712 Scenario 2 - Dow Takes support at 24680 - bottom as of today so far & holds to bounce upside giving some relief which will help India Nifty also to bounce next week on Monday 3rd...
WaveTalks - DOW -Cracks 1900 points in 2 days / Nifty - Ab tera kya hoga ? Welcome you all in the exciting update on WaveTalks !!! As per the idea published on 12th Jan 2020 - Nifty : Stellium Effect (Stellium - Astro term) Have Suggested Dow close to a primary top on 17th Jan 2020 & India Nifty made a top next week on 20th Jan 2020 - Looking for a fall close...
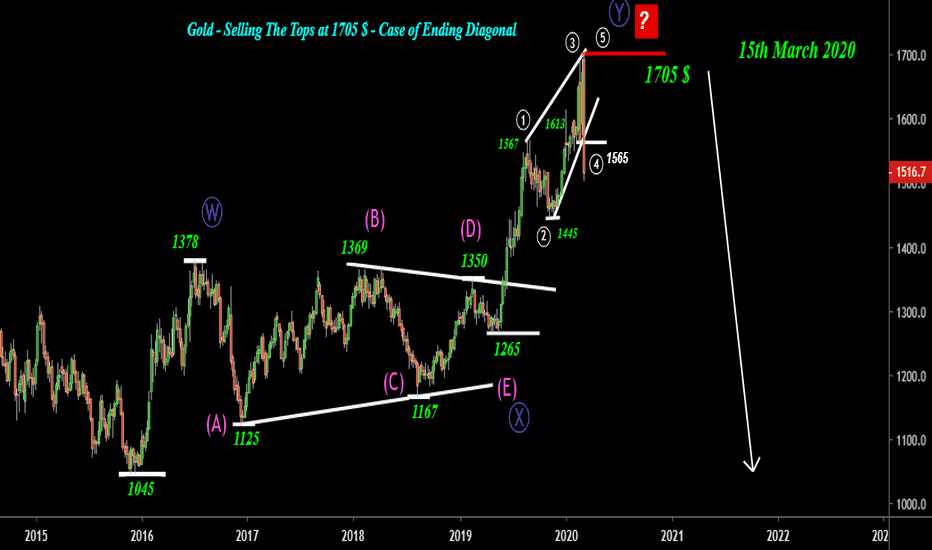
Trading Strategy Sell in 1320-1323 Zone or Sell Below 1310$ -Strict Stops above 1325$
OIL GOLD ------------------------------------------------------------------------------------------------------------------------------------- AUDUSD
Short Term Trading Strategy Looking to move upside in C-wave next for 200-250 pips & hitting the resistance zone in 0.7500 - 0.7525 zone Key Support Zone - 0.7220 - 0.7220 Critical Support Zone - 0.7165 - 0.7175 Safe Traders Kindly Do not trade below 0.7200 & Risky Traders can consider long trades above 0.7165. No one trades long position below 0.7165...
We all know Head and Shoulder (H & S) is a classic pattern which activates only below the neckline & neckline low is recent low of 1.1215 So why not take advantage of buying the pattern if it holds above 1.1250 level & any opportunity between 1.1265 - 1.1275 should be seen as good risk reward trade in next few weeks if it holds above 1.1250 mark. Upside Target...
Strict Stops above 1.1280
Happy to sell at the top@1.1500 with 2nd Gartley on 7th Nov 2018. Potential Bullish Cypher next if 1.1335 -1.1355 zone holds as support which is PRZ (Potential Reversal Zone) of Cypher Pattern Target 1 zone - 1.1445 -1.1450 Target 2 - 1.1500 (Top of the Pattern) Target 3 - 1.1600 - 1.1625 (Valid only if holds above 1.1500 mark) Last...
Short Term Call - Later Bounce Expected for higher targets above 1.1440 - close to 1.1625 Sell Call Activates only below 1.1420 with bearish gartley Target 1 - 1.1395 Target 2 - 1.1375 Stoploss - 1.1440
Hello Readers, Back after 9 months & feel amazing to see the dream come true which was expected in Jan 2018 1000 Pip Fall Makes 3000+ from 8100 to 7100 – The Australian Journey 2018 In back to back 3 legs 8100 to 7500 - 7500 to 8100 & again 8100 to 7100... Story continues What an exciting year so far as an analyst if you were on the correct side i.e. the...
JP Associate - What a fall from 10-11 zone to 6.70 recent low. Now can this harmonic structure hold the fall in JP Associate.


