readCrypto
ModHello, traders. If you "Follow", you can always get new information quickly. Have a nice day today. ------------------------------------- (MCD 1D chart) Before following the basic trading strategy, the first thing to check is whether the current price is above or below the M-Signal indicator on the 1M chart. If the price is below the M-Signal indicator on...
Hello, traders. If you "Follow", you can always get the latest information quickly. Have a nice day today. ------------------------------------- (ADAEUSDT 1D chart) ADA is forming a long-term rising channel and is showing an upward trend as it breaks above the mid-term high downtrend line. We need to see if it can rise above 0.8836 and maintain the price to...
Hello, traders. If you "Follow", you can always get the latest information quickly. Have a nice day today. ------------------------------------- (ETHUSDT 1D chart) It is showing an upward breakout of the important zone of 2419.83-2706.15. We need to see if the price can be maintained by rising above the Fibonacci ratio of 0.5 (2788.93). If so, it is...
Hello, traders. If you "Follow", you can always get the latest information quickly. Have a nice day today. ------------------------------------- (DOGEUSDT 1D chart) HA-High and HA-Low indicators are converging. Accordingly, if it breaks through the 0.21409-0.22958 section, it is expected to surge. However, since the DOM(60) indicator is formed at the...
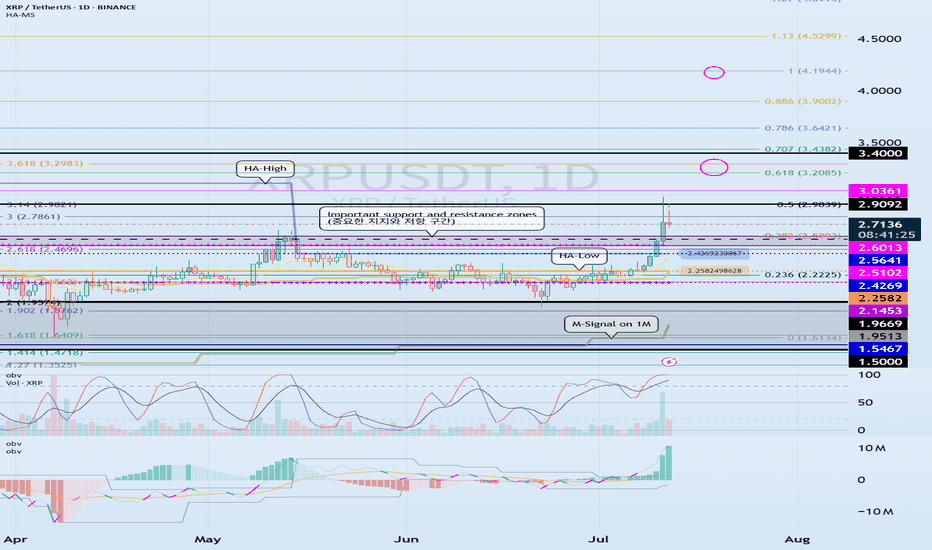
Hello, traders. If you "Follow", you can always get new information quickly. Have a nice day today. ------------------------------------- (XRPUSDT 1D chart) It has broken through the important support and resistance zone. Accordingly, the key is whether the price can be maintained above 2.5102-2.6013 and rise. If the price is maintained above 2.5102-2.6013,...
Hello, traders. If you "Follow", you can always get new information quickly. Have a nice day today. ------------------------------------- (USDT.D 1D chart) USDT dominance is showing a downward trend along the medium- to long-term downtrend line. The decline in USDT dominance can be interpreted as an upward trend in the coin market. Therefore, if it remains...
Hello, traders. If you "Follow", you can always get the latest information quickly. Have a nice day today. ------------------------------------- (TSLA 1D chart) The medium-term trend is maintaining an uptrend. However, if the price falls below the M-Signal indicator on the 1M chart and maintains, there is a possibility of a downtrend, so caution is...
Hello, traders. If you "Follow", you can always get new information quickly. Have a nice day today. ------------------------------------- HA-Low, HA-High indicators are indicators created for trading on Heikin-Ashi charts. Therefore, they are determined by Heikin-Ashi's Open, Close, and RSI values. If the RSI indicator value is above 70 when the candle...
Hello, traders. Please "Follow" to get the latest information quickly. Have a nice day today. ------------------------------------- This volatility period is expected to last until July 11th. The first volatility period, July 1-7, 3 days passed, and the second volatility period began on July 6. It is important to explain it in words, but I think it would...
Hello, traders. If you "Follow", you can always get new information quickly. Have a nice day today. ------------------------------------- EOS switched from banking to blockchain during the network reorganization. (AUSDT 1D chart) The key is whether it can rise to around 0.5013 and receive support. If not, it is likely to show a step-down trend. - (4h...
Hello traders. Please "Follow" to get the latest information quickly. Have a nice day today. ------------------------------------- (AWEUSDT 1D chart) The total supply of 2 billion has been unlocked. Therefore, it seems that temporary profit taking will occur. We will have to wait and see what kind of flow it will show in the future, but I think the key is...
Hello, traders. Please "Follow" to get the latest information quickly. Have a nice day today. ------------------------------------- (ETHUSDT 1D chart) The key is whether ETH can find support in the 2419.83-2706.15 area and rise. This is because this section is the section that needs to be supported in order for a full-fledged uptrend to begin. Therefore,...
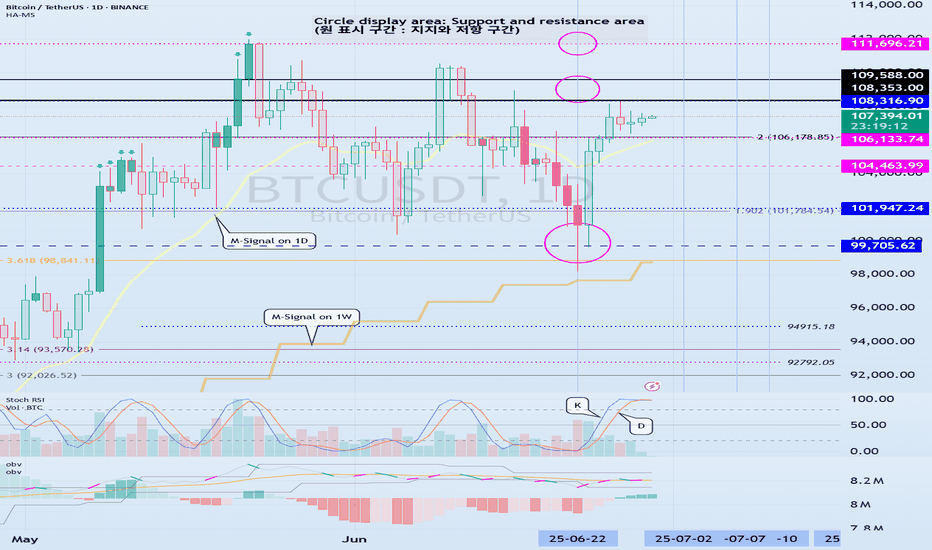
Hello, traders. If you "Follow", you can always get new information quickly. Have a nice day today. ------------------------------------- (BTCUSDT 1D chart) Among the many trend lines, the one marked 1W is the important one. Therefore, we need to look at whether it can rise above the 1W trend line or rise along the trend line. If not, and it falls below...
Hello, traders. If you "follow", you can always get the latest information quickly. Have a nice day today. ------------------------------------- (SEIUSDT.P 1M chart) I wonder what the 1M chart means on the futures chart, but if you know the current big picture trend, I think you can trade according to your main and secondary positions. Currently, the volume...
Hello, traders. If you "Follow", you can always get new information quickly. Have a nice day today. ------------------------------------- I failed to register a modified indicator of StochRSI indicator on TradingView alone, so I added it to the existing OBV by readCrypto indicator. From the top of the indicator setting window to the bottom 1. OBV indicator...
Hello, traders. If you "follow", you can always get the latest information quickly. Have a nice day today. ------------------------------------- (BTCUSDT 1M chart) A new month begins in one day. The key is whether it can hold the price by rising above 109588.0. If not, there is a possibility that it will fall below the 94172.00 StochRSI 50 indicator point...
Hello, traders. If you "Follow", you can always get new information quickly. Have a nice day today. ------------------------------------- We use the StochRSI indicator to draw a trend line. We draw a trend line by connecting the peaks of the StochRSI indicator, i.e. the K line, when they are created in the overbought area or when they are created in the...
Hello, traders. If you "follow" me, you can always get the latest information quickly. Have a nice day today. ------------------------------------- The StochRSI indicator on the left chart is slightly different from the StochRSI indicator on the right. The StochRSI indicator on the left chart is the StochRSI indicator provided by default in TradingView, and...


