BTC FORMED A RANGE BETWEEN 337 AND 500 DAY EMA .IF BTC BREAK ONE THOSE TARGET IS CLEAR FOR NEXT MOVE. CONFIRMATION IS : BTC MUST CLOSE CANDLE ABOVE OR BELOW ONE OF THOSE TO CONSIDER GOING SHORT OR LONG. GOOD LUCK.
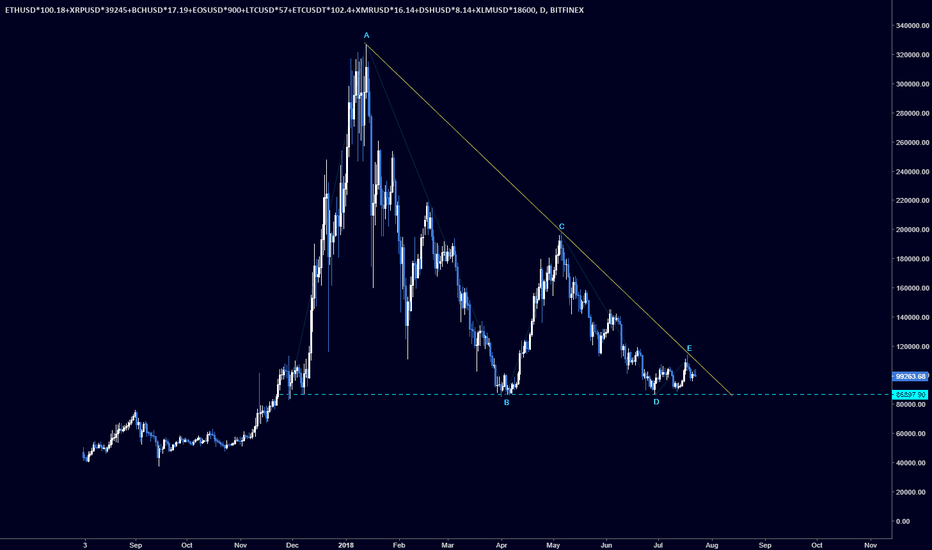
btc is in the triangle structure and is going to complete last wave of triangle to upside there is a wedge and abc wave of that wedge is complete and doji candle can be print on 4h for reverse. trade is counter trend and have high risk. good luck
IN CHART YOU CAN SEE BTC FORMED A RANGE STRUCTURE , IN TA PERSPECTIVE IF BTC BREAK RESISTANCE OR SUPPORT CAN MOVE DOUBLE THAT RANGE STRUCTURE(FIBO 2).( BOTH SIDE) if you want to see more updates on this idea give a like or comment // have a good trade/
// the weekly chart and daily show bearish pin bar and upper shadow candle// for coming weeks we might see this senario but if major resistance breached there must leg up to 127% of the leg 3 of five impuls wave// good luck
YOU CAN SEE IN THE CHART 3 DRIVE PATTERN HAVE BEEN FORMED // IN THIS SITUATION WE CAN SEE A MOVEMENT TO FIBO RETRACE LVLS// AND OTHER CONFIRMATION IS ON DXY if you want to see more updates on this idea give a like or comment // have a good trade/
on chart you can see there is a support area // if btc can hold that support ( increase positive vol) we can see movement to green box area for completing the 5 impulsive wave // if you want to see more updates on this idea give a like or comment // have a good trade/
if hd pattern structure can be form, the 2 box area is targets for coming days// if you want to see more updates on this idea give a like or comment // have a good trade/
there is some vol drop and bear div on mom / there must be drop to 38% and 61% fibo of last bull wave in matter of that bearish wedge// if major resistance breached this idea is no longer usable// if you want more update on this idea give a like or comment// good luck
vol is dropping and a hammer candle is printed on 2h // IF btc cannot overcome that resistance the double top structure is on play// targets is clear// this trade is counter trend and have a high risk// if you want to see more updates on this idea give a like or comment // have a good trade/
major support on red trend can be a cycle maker/ in the below of chart you can see the downtrend cycle is about to terminate// the falling wedge is bullish reversal pattern and if breached we can see movement to 38% & 61% fibo lvl// the time line of making new move is clear on chart// bullish div is created on macd and histo// good luck and have good...
major resistance show a high sell pressure(blue box area) if btc can overcome that there must be another leg up tp 6.8 k and 7.1k | the recent bullish move have three drive pattern and can be ended with a bearish wedge
located in wedge and abc move is about to done BUT cycle is show us there must be a bottom for quite some time and then boom! good luck.
abc alliot must be complete and wedge can be broke and bring us a good profit. cycle on chart is show us the downtrend will be terminate very soon, good luck and if this analyze deserve alike press that.
just now chart show you bad thing about altcoin. index show the altcoin is a bad invest in bull or bear scenario of btc 4.20% . good luck.
located in wedge / there is some hidden bullish div on sotch and cci-rsi but not too much strong. stop loss below long support line (5-10% loss). btc is show some movement /if btc can move slightly higher we can upward move in cardano. fundamental: august 15 Special Announcement 16 meetup 21 meetup 31 cardano v 1.3 have a good trade/ give a...
eth is in a consolidation phase and we can see double abc is complete . put some money in that can be a good choice. this bearish wave must have a some correction and upward movement. vol is dropping and we can see a big vol on eth very soon.BUT no one can say bear or bull strongly! good luck .
in ta perspective gap must be filled. this bear wave is very extended and 61 fibo lvl from pervious long swing is a good support for see a bounce. good and have a good trade.
is showed a cycle on chart and its easy to find the bottom with that. the cycle trend have good potential for a see a pullback on eos. you can see 2 wedge on chart to terminate all of the bearish wedge. last wave is equal to 1.27 on a wave and this can show us too the wave is going to terminate. trade is a counter trend and have a huge amount of risk. good luck...


