Rates hikes don't = bearishLook from 2015-2019 fed was raising rates, yet NASDAQ remained bullish the entire time. Don't buy the hype - people have no fking clue what they're talking about.
Economy

Arthur Hayes's Liquidity Index comparing to SPX, NDX & BTCUSD liquidity conditions are comprised of three parts:
The size of the Fed’s balance sheet.
FRED:WALCL The Fed credits member banks’ Fed accounts with money, and in return, banks sell the Fed US Treasuries and/or US Mortgage-Backed Securities. This is how the Fed “prints” money to juice the financial system.
The size of Reverse Repo (RRP) balances held at the NY Fed. FRED:RRPONTSYD The NY Fed allows eligible counterparties to deposit USD and earn a rate of return. The deposited funds become dead money once they enter the Fed’s account. It is dead money because the Fed does not use the deposited funds to make commercial loans. If it did, it would increase the supply of credit money in the financial system. In effect, the money multiplier for RRP balances at the NY Fed is 0x, vs. a non-zero multiple when deposited with any other financial intermediary. (Pre-pandemic, the reserve ratio requirement hovered between 3% to 10% – resulting in a 33x to 10x money multiplier for US commercial banks – but the Fed has since slashed it to 0%, meaning that commercial banks can lend out 100% of the deposits they receive with no obligations to hold any of those deposits as a safety net). Money market funds (MMF) are funds in which retail and institutions place cash to earn short-term yield. In my brokerage account, any spare cash I have is deposited in an MMF, and I can get my cash back within one business day. MMFs can deposit funds in the RRP, and a variety of other low-risk short-term credit instruments (e.g. US Treasury bonds, AAA-rated US corporate commercial paper). Leaving money with the Fed is the least risky option, and pays about the same as the other two options, which do carry some risk. Therefore, MMFs prefer to park money with the Fed, if they can, rather than in the leveraged financial economy.
The US Treasury General Account (TGA) balances with the NY Fed. FRED:WTREGEN This is the US Treasury’s checking account. When it decreases, it means the US Treasury is injecting money into the economy directly and creating activity. When it increases, it means the US Treasury is saving money and not stimulating economic activity. The TGA also increases when the Treasury sells bonds. This action removes liquidity from the market as buyers must pay for their bonds with dollars.
USD Liquidity Conditions Index = (The Fed’s Balance Sheet) – (NY Fed Total Amount of Accepted Reverse Repo Bids) – (US Treasury General Account Balance Held at NY Fed)

Strong USDFundamentals
Factors Affecting Reserve Balances of Depository Institutions reported a decrease in U.S. Treasury of $11.6 Billion ( Bullish)
Inflation expectation are decreasing (Bullish)
Exports from the United States increased by USD 4.3 billion (Bearish)
Non-farm labor productivity in the US fell ( Bullish)
Currency in circulation decreased by $428M ( Bullish)
I am still learning fundamentals so if this is wrong please let me know I want to keep getting better at this.
Student working toward my Series 86 and 87

Ever wonder what’s preventing the market from a massive crash?The answer is DEBT
Real GDP (Green) US Public Debt(yellow).
Look at how aggressively debt has grown from 1970 till today.
Just to bring this a bit closer home. It’s like constantly getting yourself in financial trouble yet the bank keeps giving you more and more credit.
If the government was an individual, it’s credit score would be less than 500. And even with a shitty score like that, they keep getting more and more into debt.
This is NOT capitalism. This is the part where gamesmanship applies.
The question becomes, what happens to our economy if the government didn’t bail out or print any NEW money for 10 years?
In other words, Be slightly paranoid when it comes to your investment philosophy.
Play offense, but stay alert.

Crash Incoming 12?United States Personal Savings ( USPS ) with the 100 EMA trend line . Since April 2020 spike, due to the 'stay at home' Covid year, savings are in a downfall. The trend line , now trending down again, was trending up since around April-May 2008.

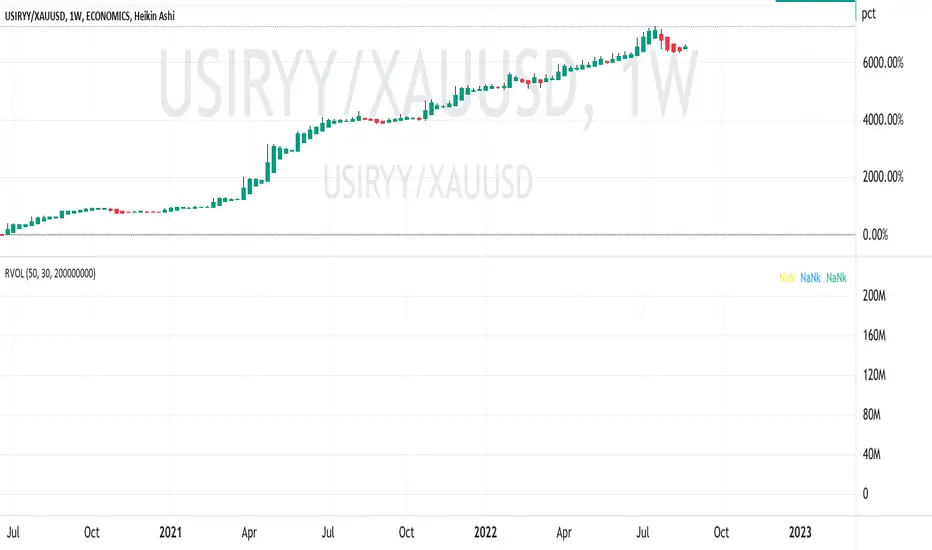
US Inflation Rate relative to Gold Price ( Bull Run preface?)As this chart shows since the onset of the Covid- Era, the inflation rate to gold price ratio has increased
over 60x in the intervening 30 month. Pricipally this is due to the inflation rate escalating while
spot gold has been stable or decreased. This would seem to suggest that gold is undervalued
and may be overdue for the price adjustment of a bull run. Time will tell as they say
reverse of Bitcoin🟠and the Trimmed Mean PCE🔵inflation rateSee the reverse of Bitcoin🟠and the Trimmed Mean PCE🔵inflation rate
The Trimmed Mean PCE inflation rate is an alternative measure of core inflation in the price index for personal consumption expenditures
What will the next month offer dear Crypto Nation?
*not financial advice
do your own research before investing

Stagflation is comingReal interest rates will probably start to fall soon because of stagflation.
Real interest rates can be measured by subtracting inflation expectations FRED:T10YIE from US treasury yields FRED:DGS10 .
Treasury yields will likely fall along with unemployment as measured by initial claims FRED:ICSA .
Initials claims has started to slowly rise and when it does treasury yields will probably go down.
Inflation expectations will likely take longer to fall because it takes longer to get prices to slow down than for unemployment to rise.
Businesses will more likely fire people than lower their prices to protect their profits and now inflation expectations are probably well anchored.
This should be bullish for silver OANDA:XAGUSD and gold OANDA:XAUUSD and negative for the dollar TVC:DXY .
When looking at the charts for primary metals and DXY it also looks like they are ready for a major turnaround.
A description of the above can also be found here:
www.forbes.com

Monthly Supply of HousesWill history repeat itself?
Is it time to call Ben Rickert, Jared and Vinny.
What would those guys think about it?
Any other time the houses supply was this high it was considered a recession.
I know what you’re thinking. Defaults are what caused the GFC.
Loan Defaults?
Delinquency rate bubbles are a result of higher interest rates and tight monetary and fiscal policy all of which are just now appearing.
The sudden increase in rates may be too quick of a shock to the system.
Who knows what other bubbles await.
There may be enough stimulus to keep it going a little while longer.
Could government spending be the bubble.
The real problems start when a negative wealth effect from falling home prices and high interest rates cause a tsunami of foreclosures.
Inflation isn’t going away and that means rates are here to stay.

SPX500 and the early indicators🔵🟠🔴look at 2007 & beforeExisting Home Sales🔵as early indicator for Single Family Home Prices🟠as early indicator for S&P500🔴
Comparing the TOPs🔵🟠🔴at financial crisis 2007 the advance warnings began 10 + 15 month before
First TOP🔵seems clear... Second maybe in🟠
Will S&P TOP out months later again dear Crypto Nation?
What are your thoughts?
*not financial advice
do your own research before investing


will silver rise along with a drop in real rates?Real rates look like they are about to turn over.
This should mean that interest rates should drop faster than the inflation.
A good proxy for this is silver which looks like it is touching a support line and the 100 MMA.

Employment Level: Plenty of Room for GrowthEmployment level is not yet overheated which is bullish for risk-on assets. A repeat of the 1981-1982 recession a possibility but trading and investing has always been about probabilities, not possibilities. 6-17% increase in employment from now is far more likely. One is allowed to be a bear, but a bear right now is far more of a gambler than a bull is.

Inflation rate peaked? or retested?So I've been tracking this for a long time - already worrying was the fact that we crossed that all-time trendline - now we just retested it. Everybody is euphoric about Inflation possibly having peaked, I'm still concerned this is just a retest.

Measuring Wage Growth per Presidential TermCaveat - both negative and positive effects of presidencies tend to carry well beyond their terms, we tend to forget this when judging performance.
Link to related idea below - measuring stock market growth per term.

Connection US GDP and Bitcoin quarterly performanceBitcoin and Crypto Nation... eat this ‼️
Found an interesting connection of quarterly reported US GDP and the prediction of the following quarter performance of BTC - no joke - look at the chart ‼️
Kind of sentiment effect IMO
Thursday GDP increase expected - bullish Q3 for Bitcoin ??!!
Tell me your thoughts in that idea
*not financial advice
do your own research before investing

A Clear Signal of Economic ContractionUnemployment vs. Central Bank Tightening
We know there's a shifting of the tides. With unprecedented Monetary Policy to rescue the economy due to never before seen economic maladies. Dotcom, Housing Market Collapse, and now the C-19 Pandemic. We saw the Fed's policies fail during the Great Depression, could we continue to trust this policy to course correct an inherently broken system?
The simplest view of this is as an indicator of economic contraction preceding major Recessions. Now, combine this with yield curve inversions of both the 10 and 2-year yields, now, with a drastic move in the 3-month vs 10-year yield and we should be wary.

SP500 Trading AnalysisConsolidation 3780-4380
Green zone is the support level
Red zone is the resistance level
Subscribe and share

FED Fund Rate, US Bonds and Inflation PredictionThe blue line area shows the historic and current FED's Fund Rate.
Looking back in the past it appears the US10Y (yellow line) is predictive of FED's fund rate upper target (orange arrows).
The US3M (turquoise line) seems to be a good indicator to get a feeling for the FED's fund rate short-term up or downward trend.
In the FOMC Summary of Economic Projections Jun 15 '2022 the FOMC had the midpoint of target range or target level for the federal funds rate at around below 4%
2022: 3,39% midpoint, 2023: 3.78%, 2024: 3.01% and >2024: 2,24% (ghost feed in the red box on the right).
So all that noted it would appear the FED Funds rate is to be expected at just below 4% at around 3.8%.
The next FOMC meeting will give as an update on that from the perspective of the FED.
And as a general indicator you need to know the FED uses the 10 Year- 3 Month Treasury Yield Spread (white line) as follows:
The 10 Year- 3 Month Treasury Yield Spread is the difference between the 10 year treasury rate and the 3 month treasury rate.
This spread is widely used as a gauge to study the yield curve. A 10 year-3 month treasury spread that approaches 0 signifies a
"flattening" yield curve. Furthermore, a negative 10 year-3 month spread has historically been viewed as a precursor or
predictor of a recessionary period. The New York Fed uses the rate in a model to predict recessions 2 to 6 quarters ahead (white arrows).
--------------------------------------------------------------------------------------------------------
** Please support this idea with your likes and comments, it is the best way to keep it relevant and support me. **
--------------------------------------------------------------------------------------------------------
!! Donations via TradingView coins also help me a great deal at posting more free trading content and signals here !!
--------------------------------------------------------------------------------------------------------


ECONOMIC UNITED STATES GDP compared with Other NationsThis chart illustrates the GNP of the USA compared with others over a period
of several decades. The USA is on a much slower trajectory of growth than
all the other countries on the chart except Russia and Ukraine. This
includes the Eurozone, China, India, Mexico, and others. This trend
has been in place for decades. It makes for a poor prognosis for
the future of the US economically, no matter how much our politicians
and other influencers try to hide this.


A Bearish Call On Financial Markets and The Global Economy China/Europe/EM: The UK and the entirety of Europe are in trouble. The UK now experiencing double-digit inflation and to make matters worse they are facing extreme weather and an energy shortage going into the winter. All the while Putin's war is complicating European energy supply and political ties even further. China is experiencing civil unrest, mostly thanks to an ugly property crisis. China also is experiencing lower-than-expected GDP growth. China's economy slowing has large implications given its massive presence in global trade. Emerging markets are struggling partly due to an incredibly strong dollar as well as a tight global food/energy supply.
US: The US housing market is in a recession with 6 straight months of declining sales and more importantly a monthly decrease in median home prices for the first time in years (the housing market gets hit first by rising rates… remember 08?). US consumer credit I.e., debt levels, are through the roof. Signaling that the consumer might not be as strong as market commentators are saying. Layoffs are increasing steadily, while inflation is staying high. I am bothered to see the number of peak inflation calls after just ONE MONTH of zero gains in headline inflation. The FED is now in a lose-lose scenario where they can continue to aggressively tighten and bring down this wildly levered up global economy or back out and try to save the issue for a later date. The latter would cause additions to the size of their already immense balance sheet and create an ultra-severe recession later down the line. Either way, the recent rate hikes have not at all been fully felt by markets, and add on the possibility that the FED truly commits to QT, then a few quarters down the line we will start to see a serious weakening of market conditions across the board (equities, bonds, real estate, you name it).
Forecast: Risk assets globally are going to get decimated during the next several months of trading, especially low-quality speculative names. Crypto investors should prepare to see some nasty losses, BTC to 9800, and ETH to 575 seem attainable in the medium-term. S&P 500 will NOT make any substantial or sustainable gains over the 4300 mark, 3500 is my next low target. Nasdaq 100, like crypto, is in for a large selloff, next target: 10,200. VIX will rise substantially, and could easily double from current levels. The dollar will stay higher as US rates rally upward, likely well higher than markets currently have priced in. Some commodities will make new highs- nat gas- while others like oil are poised to depreciate modestly but remain historically high. Low/non-profitable, high debt companies- Wingstop and its zombie cohorts - are at high risk of bankruptcy in the coming quarters. Widespread bankruptcies are on the horizon. Things look a little too good to be true right now in financial markets… well that's because they are. On the bright side, this bear market bounce of the past 60ish days has provided a good opportunity to exit risk assets, load up on cash and begin to add on to short positions.
As always this is not financial advice. Good luck!
