M2 Supply Total Money Supply from February 1st 2020 to March 1st 2022
Increase of 41% of total money supply
Economy

US Inflation is Nearing a Harmonic PeakIf we are to base our views of this chart like we would any other price chart, the harmonics we see forming here would imply that US Inflation is reaching a peak and that we will see Inflation come down signfiicantly over the the coming years. If i were to give a target i'd say we'd wanna see it come down to atlest 3% as a first target but it could go down even more depending on how tight things get.
The smaller harmonic is a Bearish Butterfly with a reversal zone between the 1.272 and 1.618 and the bigger one if we get that high is a Bearish Shark. Ideally we'd like to see the Butterfly playout and us not to have to go as high as the Shark.

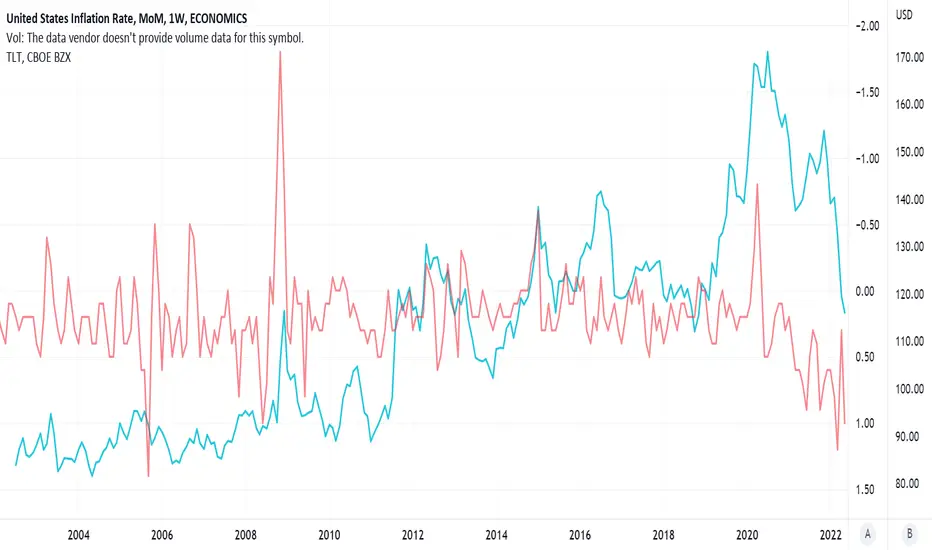
Inverted TLT compared to month-over-month inflation rate in U.S.Pretty clear that TLT trades opposite inflation.
The governments and central banks of the world are all trying to kill inflation.
Comparison of German and US month over month inflation rates.Comparison of German and US month over month inflation rates. Germany's data came out ahead of our PCE number tomorrow so looking for correlations here.

🔥 Has Inflation Peaked? A Century Old Trend Suggests YesWith inflation rising, the FED is applying quantitative tightening to the US market and the Dollar, which has caused chaos in the market of 2022. The market fears that the FED is not doing enough to combat this inflation, which will cause higher inflation, which will eventually cause further chaos in the markets.
However, looking at the chart it seems that inflation is currently at a massive "resistance" which has developed over the last 100 years or so. If inflation were to adhere to the trend, we can assume that inflation has peaked and will move down from here onwards, which would result in much better (bullish) market conditions.
I'm aware that applying TA on fundamental data like inflation is generally speculative at best. I think that inflation will rise further as long as the FED is unable (or unwilling) to rise the interest rates further.
Nevertheless, I think this analysis can shed a different light on on the most important piece of data of 2022.
Time will tell.
Do you think think inflation has peaked? Share your thoughts in the comments.

Comparing SPX performance vs ISM Manufacturing IndexIt is interesting to note that there is a current clear divergence between the SPX and the ISM Manufacturing Index, that started back in January 2019 when the Fed stopped raising rates. The SPX has shot higher, while the ISM has continued to drop crossing below 50 and therefore indicating a contraction. In the past this drop below 50 has lead to a stock market selloff. Maybe the economy isn't as great as some people make it out to be?

Case-ShillerYOY% and BTCUSD are Correlated = Danger for BTCUSDThis bodes ill for BTCUSD at a time when housing prices and rent are a national policy priority

Consumer Credit - The Impending CollpaseConsumers are spent.
Mean
Median
Spent
_______________________
Observe CC closely as it is a leading Economic Indicator.

FED Balance Sheet - Ex-Shadow Operations / Ex- FASB 56Run-Off...
The only thing running is Bids for MBS and USTs.
After an aggressive May 25th, $51 Sell ahead of
the June 15th Taper was stopped dead in its tracks.
____________________________________________
Imagine swimming in the middle of the vast Pacific Ocean.
Bumping into Flotsom and Jetsom every so often.
It's lonely out there...
Nowhere to run.
Paddle?
You'd need a Lifeboat.
It Sunk.

Savings Rate - Free Falling - 90% CollapseWhois gonna buy all those Model Y's, iPhone 14's/13''s/11's, and assorted GPUs for strip mining Klepto Coins?
Apparently - far fewer now.
A 90% collapse in the Personal Savings Rate...
Not Bullish.
_____________________________________________________________________________________________
Consumer Credit expansion is Historic.

sp500 predictor ?so in blue USM2 / USUP * 10y2y / NQCICBER
in orange the sp500 , my suscription give just this short historic , so what do you see in the past please ?


Consumer Price Index: EU vs UK vs Cyprus vs Portugal5 years comparison between CPI for EU overall, UK, Cyprus and Portugal

US Inflation vs Fed Fund RateThe difference between US Inflation (YoY) and Fed Fund Rate reaches all time high, higher since 1955.
I conclude, The Fed is really fall behind the curve (vs Inflation).
The Fed must take a huge step. No wonder market worry.

FED Balance sheet and Nasdaq ComparisonNASDAQ:QQQ
As you can see on the chart, FED balance sheet should be adjusted, as you it just started to go down, but QQQ already is 20% down from the top.
so obviously the bear market just started. and I expect more than 50% now. the most powerful and longest bear market of all time.
*This is my idea and could be wrong 100%

Inflation creating Structural damage to GDP#GDP is in SERIOUS trouble as it hasn't had previously this much difficulty out pacing inflation (momentum loss).
The under performance is historically SEVERE, more that the 1970's.
Previous 2 times GDP stalled like this, #spx went nowhere for thousands of days.
#gold
